



Hot CPI and the Dollar Put Gold Under Pressure
Spot gold is lower Wednesday after giving back an early rally. The market climbed as high as $4,066.77 before sellers returned, pushing prices to about $4,014 an ounce. December gold futures were also lower near $4,022. The pressure is coming from hotter inflation, rising Treasury yields and a stronger U.S. Dollar.
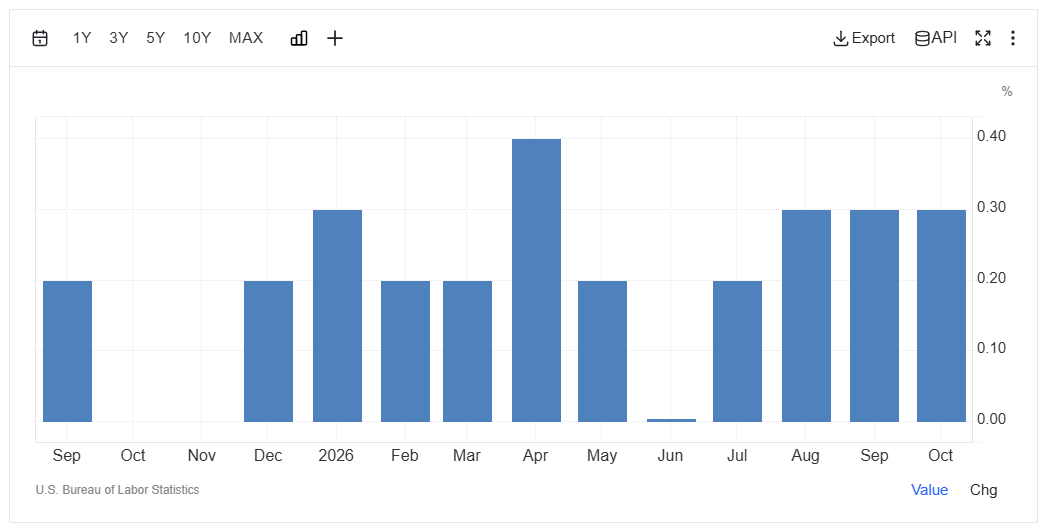
Gold was already weakening before the inflation report. Tuesday’s sell-off drove prices down about 3% after October consumer inflation came in hotter than expected. Headline CPI rose 0.4% for the month versus a 0.3% estimate. Core CPI gained 0.3%, topping the 0.2% forecast.
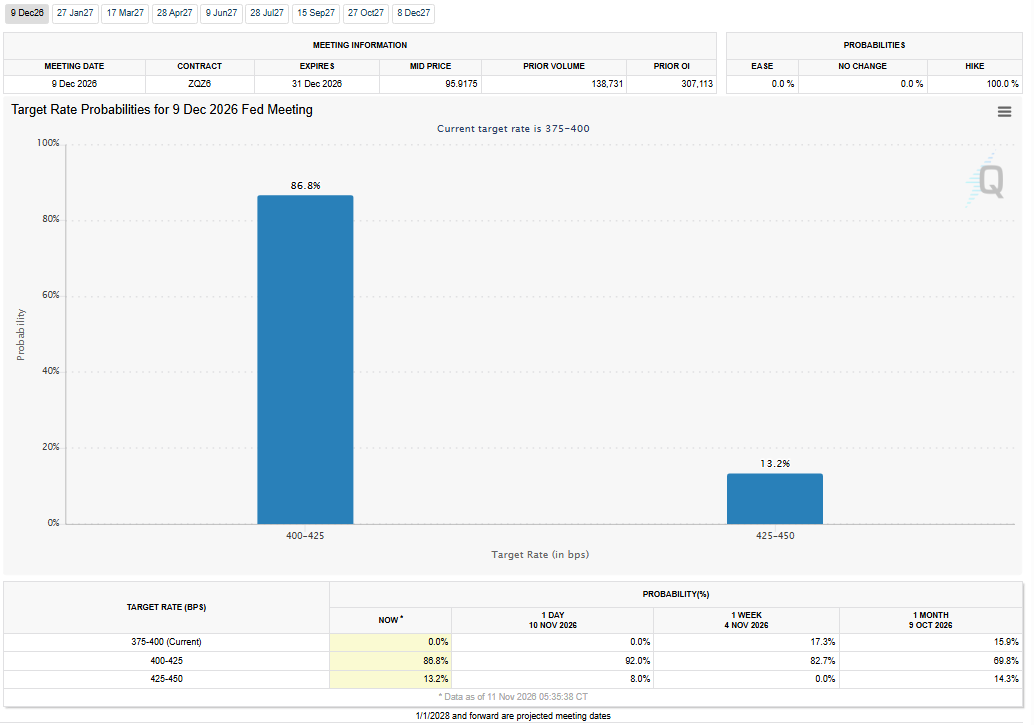
The report gave traders another reason to price in a December Federal Reserve rate hike. The market had been warned ahead of the data when Fed Governor Christopher Waller said a 0.3% core reading would make him consider a 50-basis-point increase. Core CPI came in at that number. A 25-basis-point hike is now fully priced in, while bets on a larger move have increased.
That is helping the U.S. Dollar. The Dollar Index climbed to its strongest level since April 2025 as traders reacted to the CPI numbers and the latest hawkish Fed comments. The dollar is also gaining against the Japanese yen and euro. That is a problem for gold because it makes dollar-priced bullion more expensive for overseas buyers.
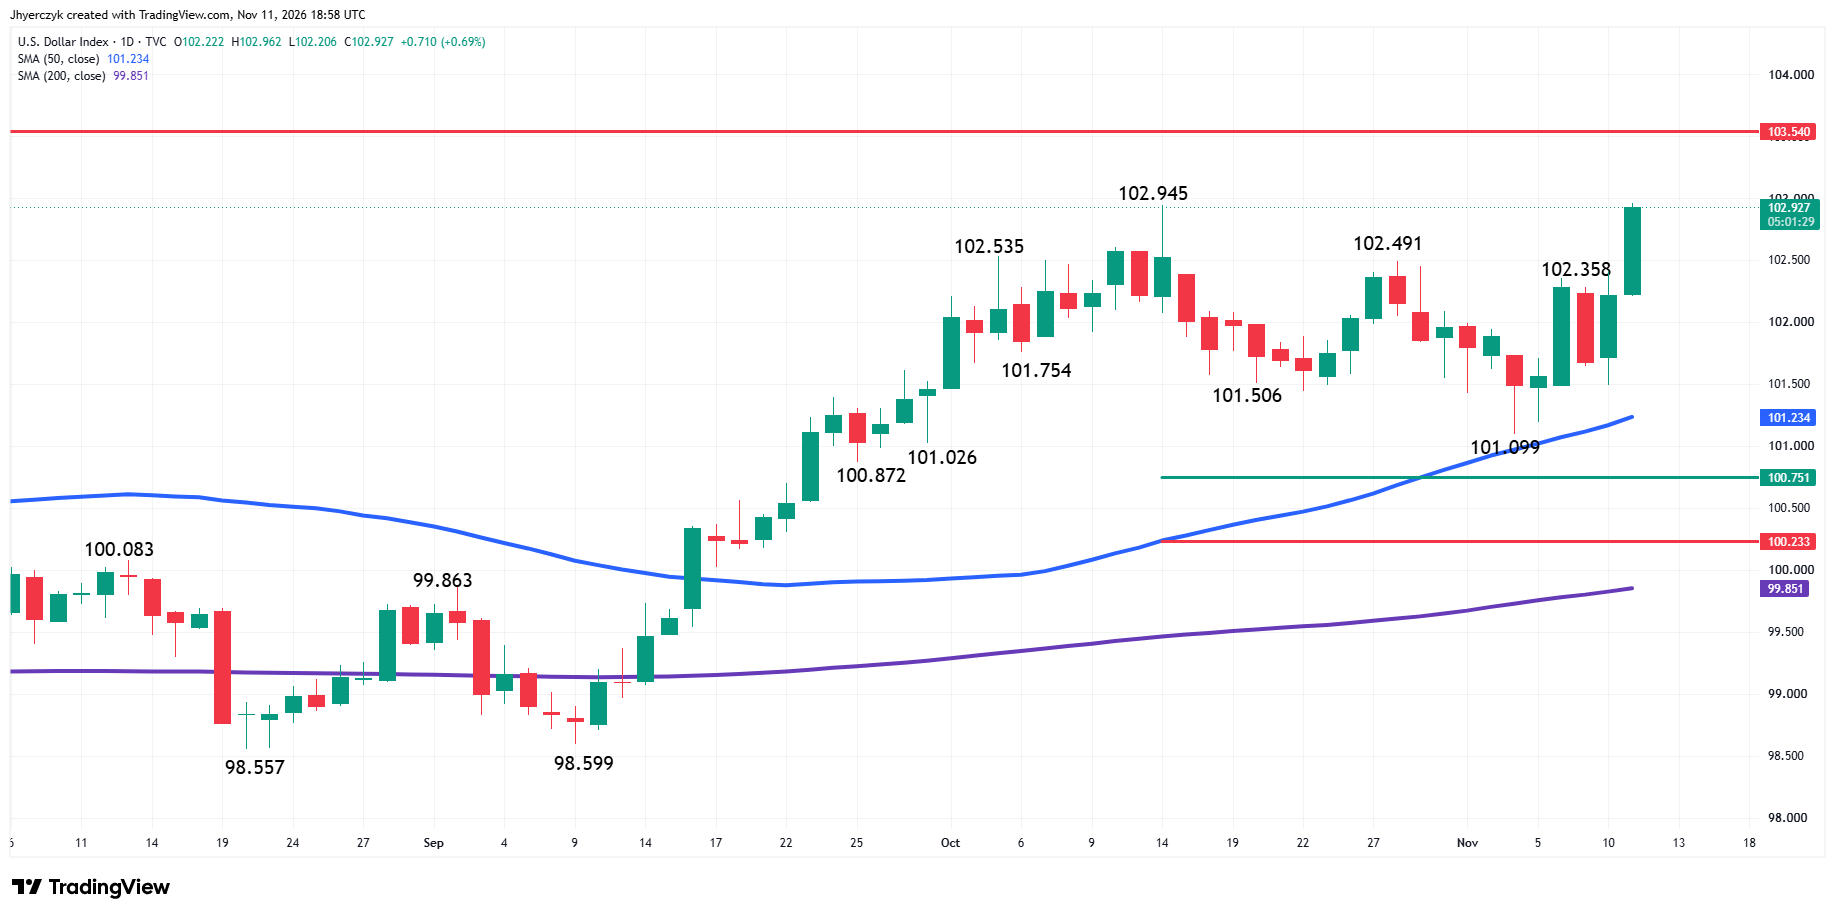
Technically, the U.S. Dollar resumed its recent uptrend after taking out the swing top at 102.491. The move was reaffirmed later in the session when main top resistance at 102.945 was penetrated. If momentum continues to increase then look for a potential surge into a long-term top at 103.540.
Looking at the downside, the recent break from 102.945 on October 26 may have changed the main trend to down on the daily chart, but the selling pressure never broke the 50-day moving average at 101.233, suggesting the presence of buyers throughout the move.
The immediate issue for gold is whether sellers can extend the break or if buyers step in on lower prices. The market needs softer inflation data, lower yields or a weaker dollar to attract aggressive buying. Until then, rallies are likely to run into sellers who expect rates to stay higher for longer.
Daily Spot Gold (XAUUSD) Technical Analysis
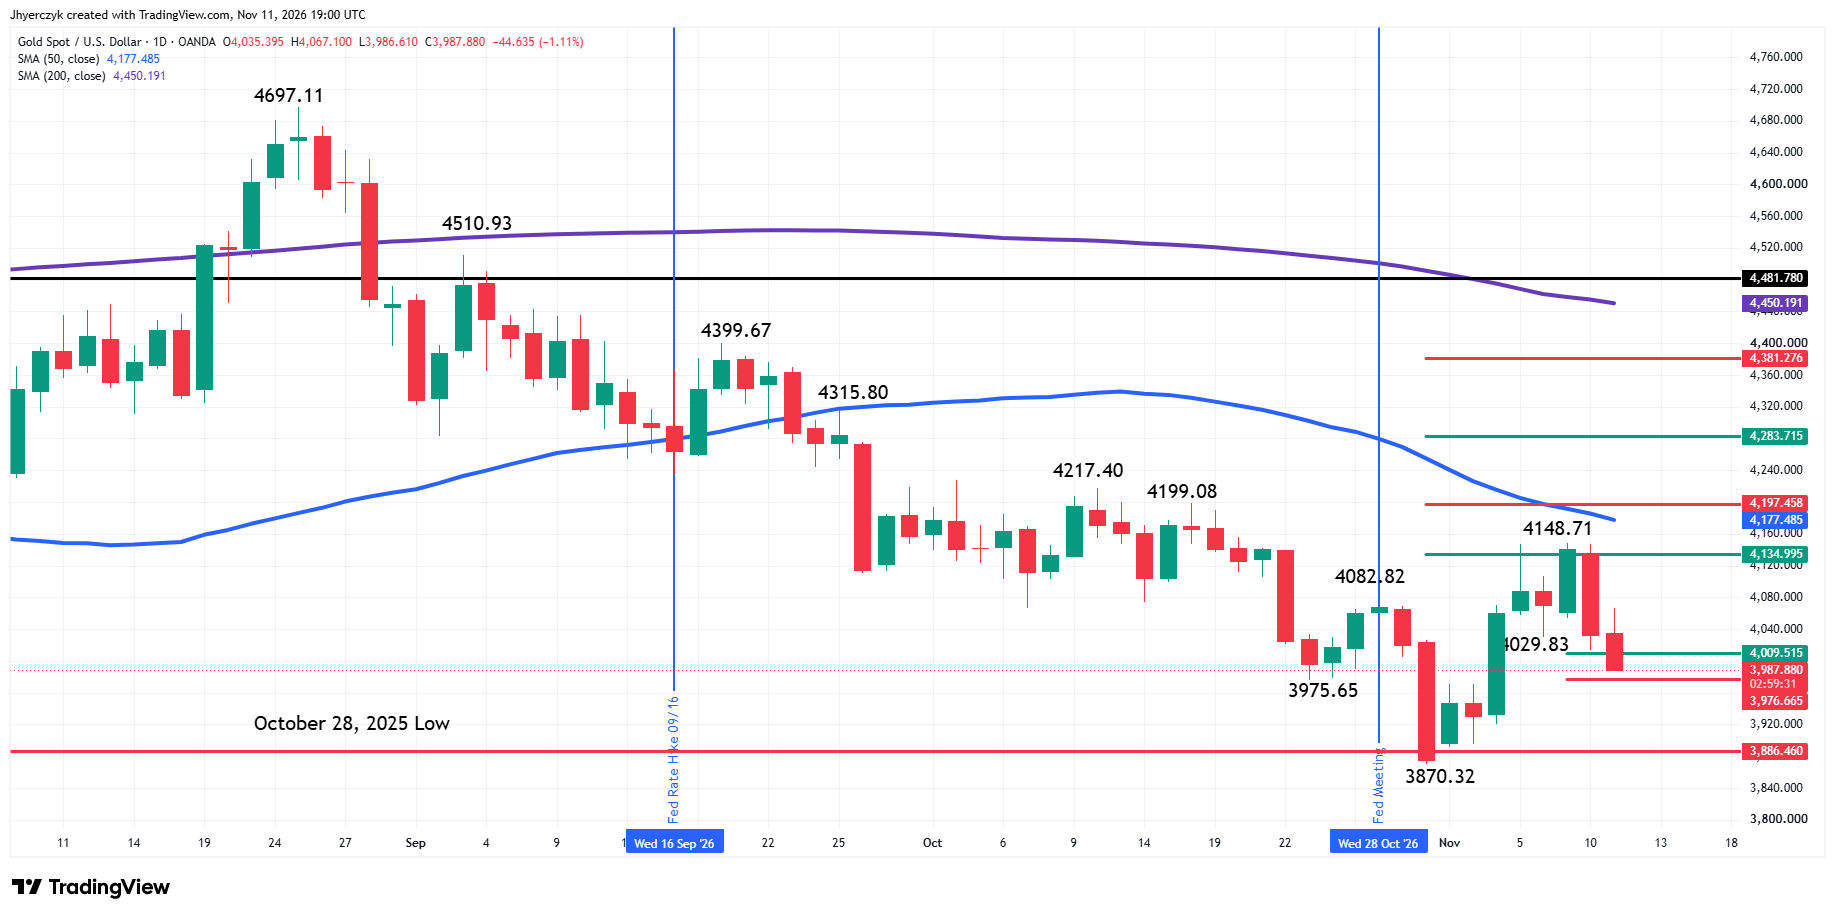
Spot gold is under pressure for a second session late in the day on Wednesday. The main trend is up according to the daily swing chart, but the minor trend is down, adding to the intraday volatility. A trade through $3870.32 will change the main trend to down. Taking out $4148.71 will signal a resumption of the uptrend.
The minor trend is down. It changed to down on Tuesday when the minor bottom at $4029.83 failed to hold as support. This move may have shifted momentum to the downside.
The short-term range is $3870.32 to $4148.71. XAUUSD is currently testing its retracement zone at $4009.51 to $3976.66.
The intermediate range is $4399.67 to $3870.32. Its retracement zone at $4135.00 to $4197.46 is resistance. It stopped the rally on Monday at $4148.71. Inside this zone is the 50-day moving average at $4177.43.
The long-term range is $4697.11 to $3870.32. Its retracement zone resistance is $4283.72 to $4381.28.
Gold Price Forecast
Every new Gold analysis as it publishes, today's technical signal and key levels, live price — on one page.
See all Gold forecastsWhat to Watch
Spot Gold (XAUUSD)
Despite the uptrend on the main swing chart, my bias is to the downside into the close, but it hinges upon trader reaction to the short-term retracement zone at $4009.51 to $3976.66. Strengthening my downside bias is the reaction to the resistance zone at $4135.00 to $4197.46, the downtrending 50-day moving average at $4177.43 and the bearish minor trend indicator.
My near-term focus is going to be on the short-term retracement zone. A sustained move over the 50% level at $4009.51 could be an early sign that buyers have returned. Their primary purpose is to create a potentially bullish secondary higher bottom.
A sustained move under the 61.8% level at $3976.66 will strengthen my bearish outlook. This could trigger an acceleration to the downside with the main bottom at $3870.32 the next major target.
The price action this week suggests that the first leg up from $3870.32 to $4148.71 may have been fueled by short-covering. A confirmed secondary higher bottom may be the first sign of passive bidding. The next move will need to be fueled by the taking of offers.
As long as gains are capped by the 50-day moving average at $4177.43 and underpinned by the main bottom at $3870.32, a sideways trade could form a support base. I don’t think we’ll see a strong breakout to the upside unless new buyers can overcome the 50-day moving average with conviction.
If you’d like to know more about how to trade gold, please visit our educational area.