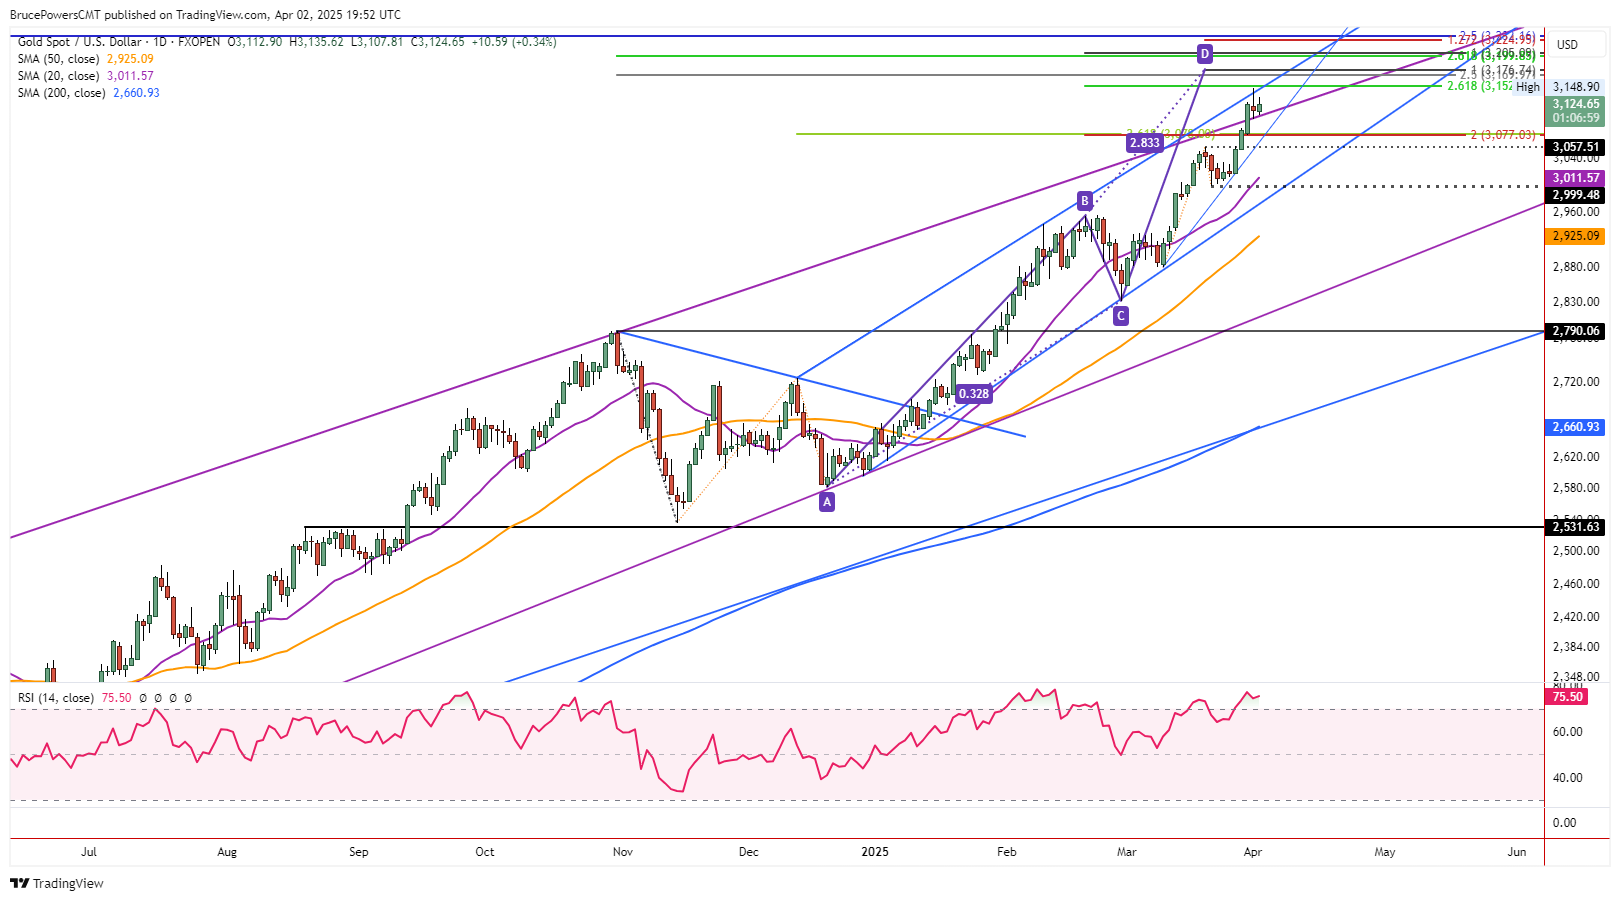
Gold maintained signs of upward momentum on Wednesday, as the risk of a bearish pullback increased at the same time. A new record high of $3,149 was established on Tuesday, with the day ending with a potentially bearish shooting star candlestick pattern. But the pattern is not valid until there is a drop below the Tuesday’s low of $3,101.
That did not happen today as Wednesday’s price range at the time of this writing was $3,108 to $3,136, which is an inside day. It is interesting to note that there is the possibility that gold closes the day’s session at its highest daily closing price ever. That would happen with a daily close above Monday’s closing price of $3,124.

Retains Channel Breakout
Notice that there is a higher daily low today and that support for the past two days was at a prior top trend channel line (purple). That line is the top of a long-term channel starting from February 2024. Signs of support at a prior resistance line is a sign of strengthening.
Nonetheless, what happens next is what matters. Is the bull channel breakout sustained or is it followed by a decline back into the channel. There is also a smaller rising parallel trend channel (blue) on the chart marking resistance around Tuesday’s high. That high also completed a 261.8% retracement of the bearish correction begun in the second half of February at $3,153.
Above $3,153 is $3,170
Especially if gold can stay above the top purple channel line, it has a chance to continue towards higher potential targets. Above the 261.8% retracement level is a small target range from $3,170 to $3,177, consisting of the 250% retracement of the October 2024 decline, and the initial target from a rising ABCD pattern, respectively.
Bearish Shooting Start Triggers Below $3,101
On the downside, a drop below Wednesday’s low of $3,108 puts Tuesday’s low of $3,101 at risk of failing as well. Gold would then be back below the top channel line and likely heading towards a test of support around the prior pivot around $3,077, and the recent high at $3,058. Further down is potential support at the 20-Day MA, now at $3,012.
Gold Price Forecast
Every new Gold analysis as it publishes, today's technical signal and key levels, live price — on one page.
See all Gold forecastsFor a look at all of today’s economic events, check out our economic calendar.