



June Comex Gold futures are trading higher on Thursday. Buyers are reacting to the weaker U.S. Dollar, geopolitical concerns over U.S. – China trade and the shedding of higher risk assets. Some traders are also saying that the language in the Fed’s monetary policy statement is supportive because it implies the central bank would allow inflation to overshoot its inflation target.
Daily Swing Chart Technical Analysis
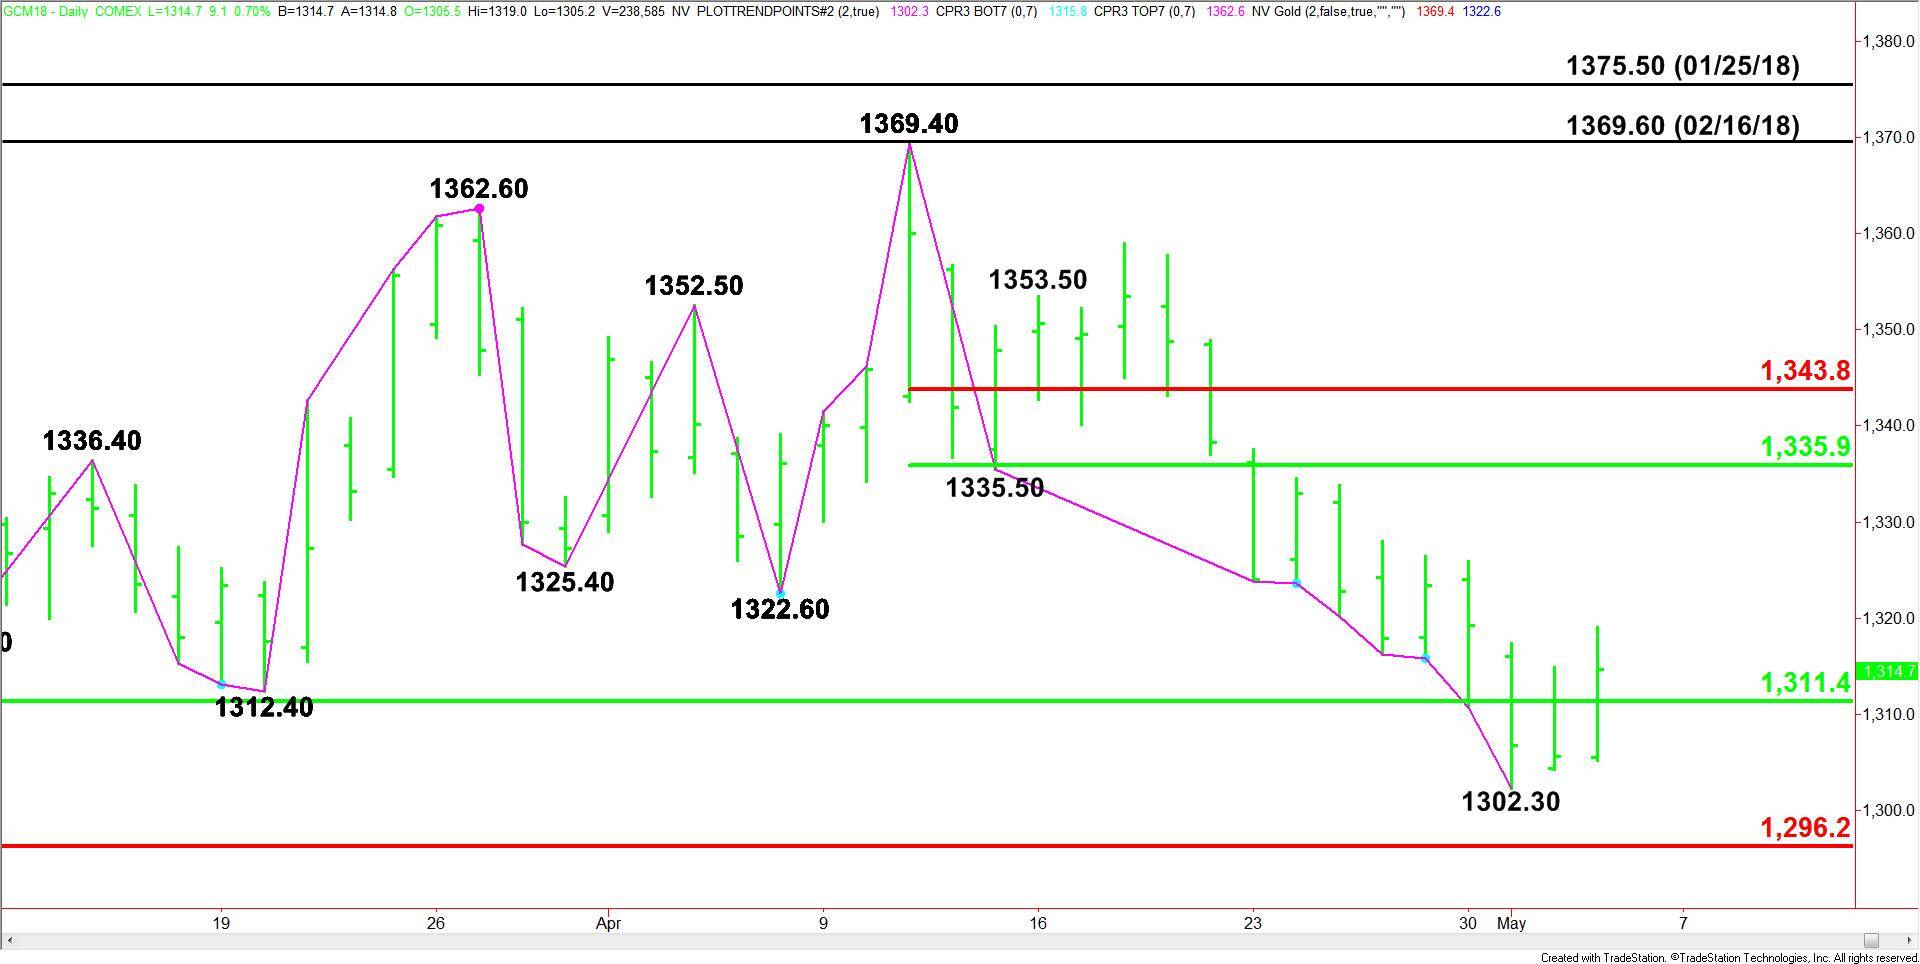
The main trend is down according to the daily swing chart. However, the price action this week suggests the market may be trying to form a support base for the start of a counter-trend rally.
A trade through $1302.30 will signal a resumption of the downtrend. The market isn’t close to changing the trend to up, but there is room on the daily chart for a strong short-covering rally.
The support is being provided by a major retracement zone at $1311.40 to $1296.20. This week’s low at $1302.30 falls inside this range.
The main range is $1369.40 to $1302.30. If there is a meaningful short-covering rally then its retracement zone at $1335.90 to $1343.80 will become the primary upside target.
Daily Swing Chart Technical Forecast
Based on today’s price action, the direction of the gold market the rest of the session is likely to be determined by trader reaction to the 50% level at $1311.40.
A sustained move over $1311.40 will indicate the presence of buyers. If this move generates enough upside momentum then we could see a rally into $1335.90 over the near-term.
A sustained move under $1311.40 will signal the presence of sellers. This could trigger a further break into $1302.30 then $1296.20.
Look for an upside bias into the close as long as gold stays above $1311.40.