


February Comex gold futures are trading at their highest level since December 1. Thin trading conditions and a weaker U.S. Dollar are behind the rally. The absence of the major players suggests there isn’t a stopper in the market today. Weaker U.S. equity markets are also sending investors into the gold market.
Daily Technical Analysis
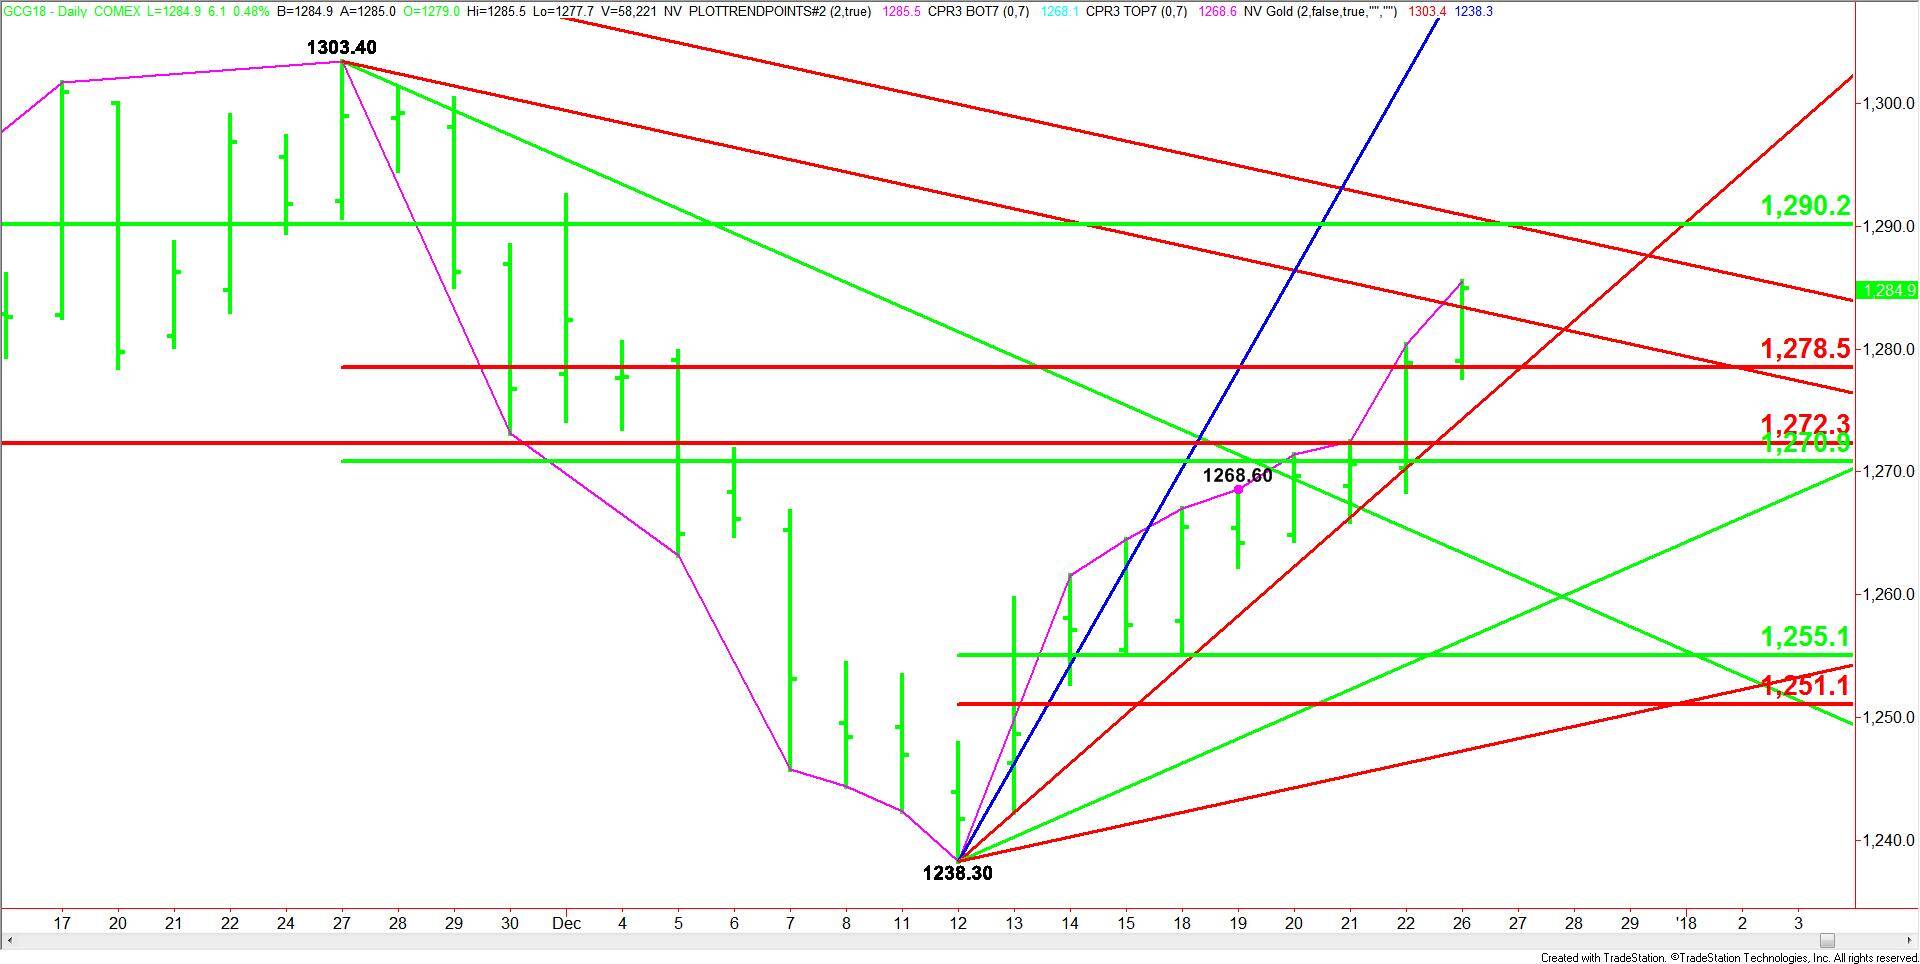
The main trend is down according to the daily swing chart, however, momentum is trending higher. Gold has posted a higher-high for nine straight sessions. The prolonged move in terms of price and time has put the market in the window of time for a closing price reversal top, but this doesn’t look like it’s going to be a major factor today.
The market is currently trading inside a long-term retracement zone at $1290.20 to $1272.30. These levels are resistance and support, respectively. This zone is controlling the longer-term direction of the market.
The main range is $1303.40 to $1238.30. Its retracement zone is $1270.90 to $1278.50. These two levels are new support. Trading above this zone is also helping to give the gold market an upside bias.
Daily Technical Forecast
Based on the early trade, the direction of the gold market the rest of the session is likely to be determined by trader reaction to the downtrending Gann angle at $1283.40.
A sustained move over $1283.40 will indicate the presence of buyers. This could create the upside momentum needed to challenge the major 50% level at $1290.20 and a longer-term downtrending Gann angle at $1290.90.
A sustained move under $1283.40 will signal the presence of sellers. This could drive the market back into a steep uptrending Gann angle at $1274.30, followed by the major Fibonacci level at $1272.30, followed by the main 50% level at $1270.90.