



June Comex Gold futures are trading lower shortly after the regular session opening. The market is being pressured by a stronger U.S. Dollar and expectations for additional rate hikes by the Fed later this year. Investors are also liquidating long positions ahead of the start of the Fed’s two-day meeting later today.
On Wednesday, the Fed is likely to leave its benchmark interest rate unchanged, but the hawkish language in its monetary policy statement will likely point to a quarter-point rate hike in June and another one later in the year.
Daily Swing Chart Technical Analysis
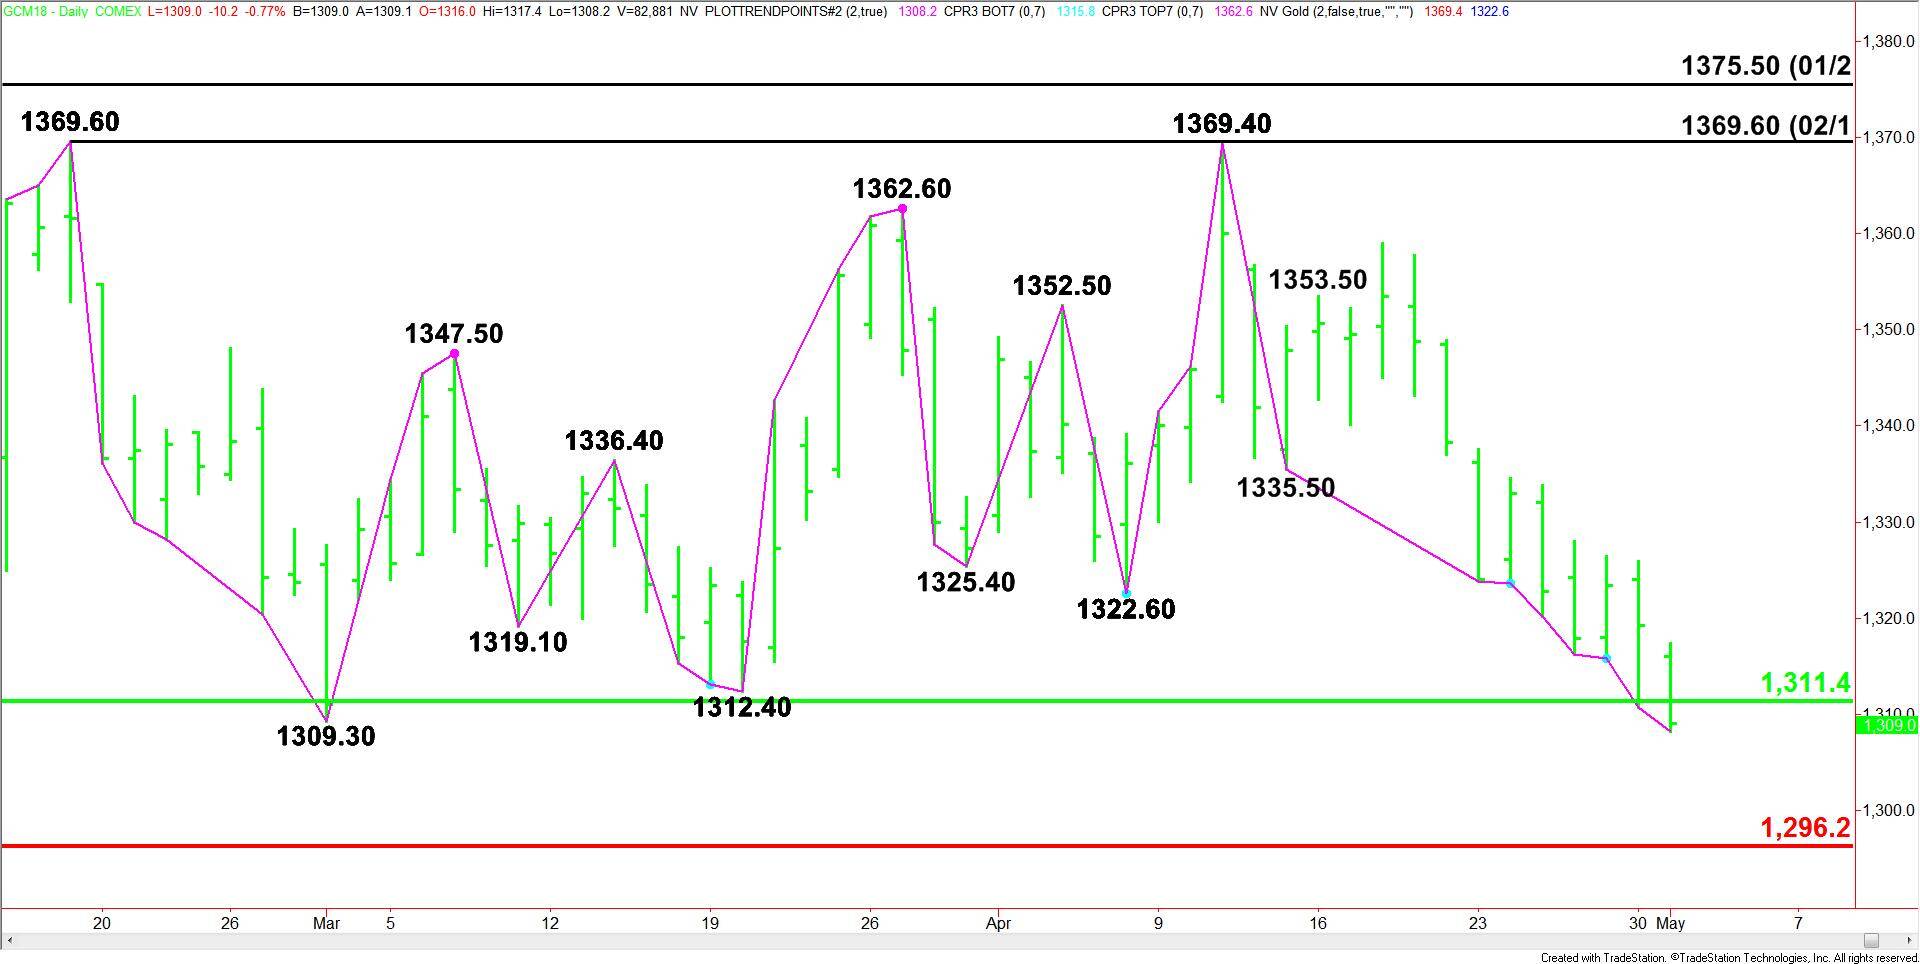
The main trend is down according to the daily swing chart. The downtrend was reaffirmed earlier today when sellers drove the market through the March 1 bottom at $1309.30.
The market is also testing a major retracement zone at $1311.40 to $1296.20.
Despite the strong downtrend, gold is trading in the window of time for a closing price reversal bottom. This move is not likely to lead to a change in the trend, but it could fuel a short-covering rally. If selling begins to slow then take action against a reversal if short.
Daily Swing Chart Technical Forecast
With the market trading at $1308.70, the new resistance is the old bottom at $1309.30, the main 50% level at $1311.40 and the old bottom at $1312.40. Buyers will have to overcome these levels to generate some upside momentum. Crossing to the strong side of yesterday’s close at $1319.20 will signal the buying is getting stronger. This will also put gold in a position to form a closing price reversal bottom.
If the downside momentum continues then look for the selling to extend into the major Fibonacci level at $1296.20.