



February Comex Gold futures are trading flat shortly before the U.S. opening. There was no follow-through to the upside following yesterday’s rally. The market is trading inside yesterday’s range which indicates investor indecision and impending volatility.
Traders will be watching a couple of Fed speakers and Fed Chair nominee Jerome Powell’s testimony before Congress for direction. Hawkish remarks should be bearish for gold. Positive developments towards U.S. tax reform should also weigh on prices as well as increased demand for higher risk assets.
Dovish remarks from the Fed officials and issues with tax reform could drive the dollar lower which would be supportive for gold.
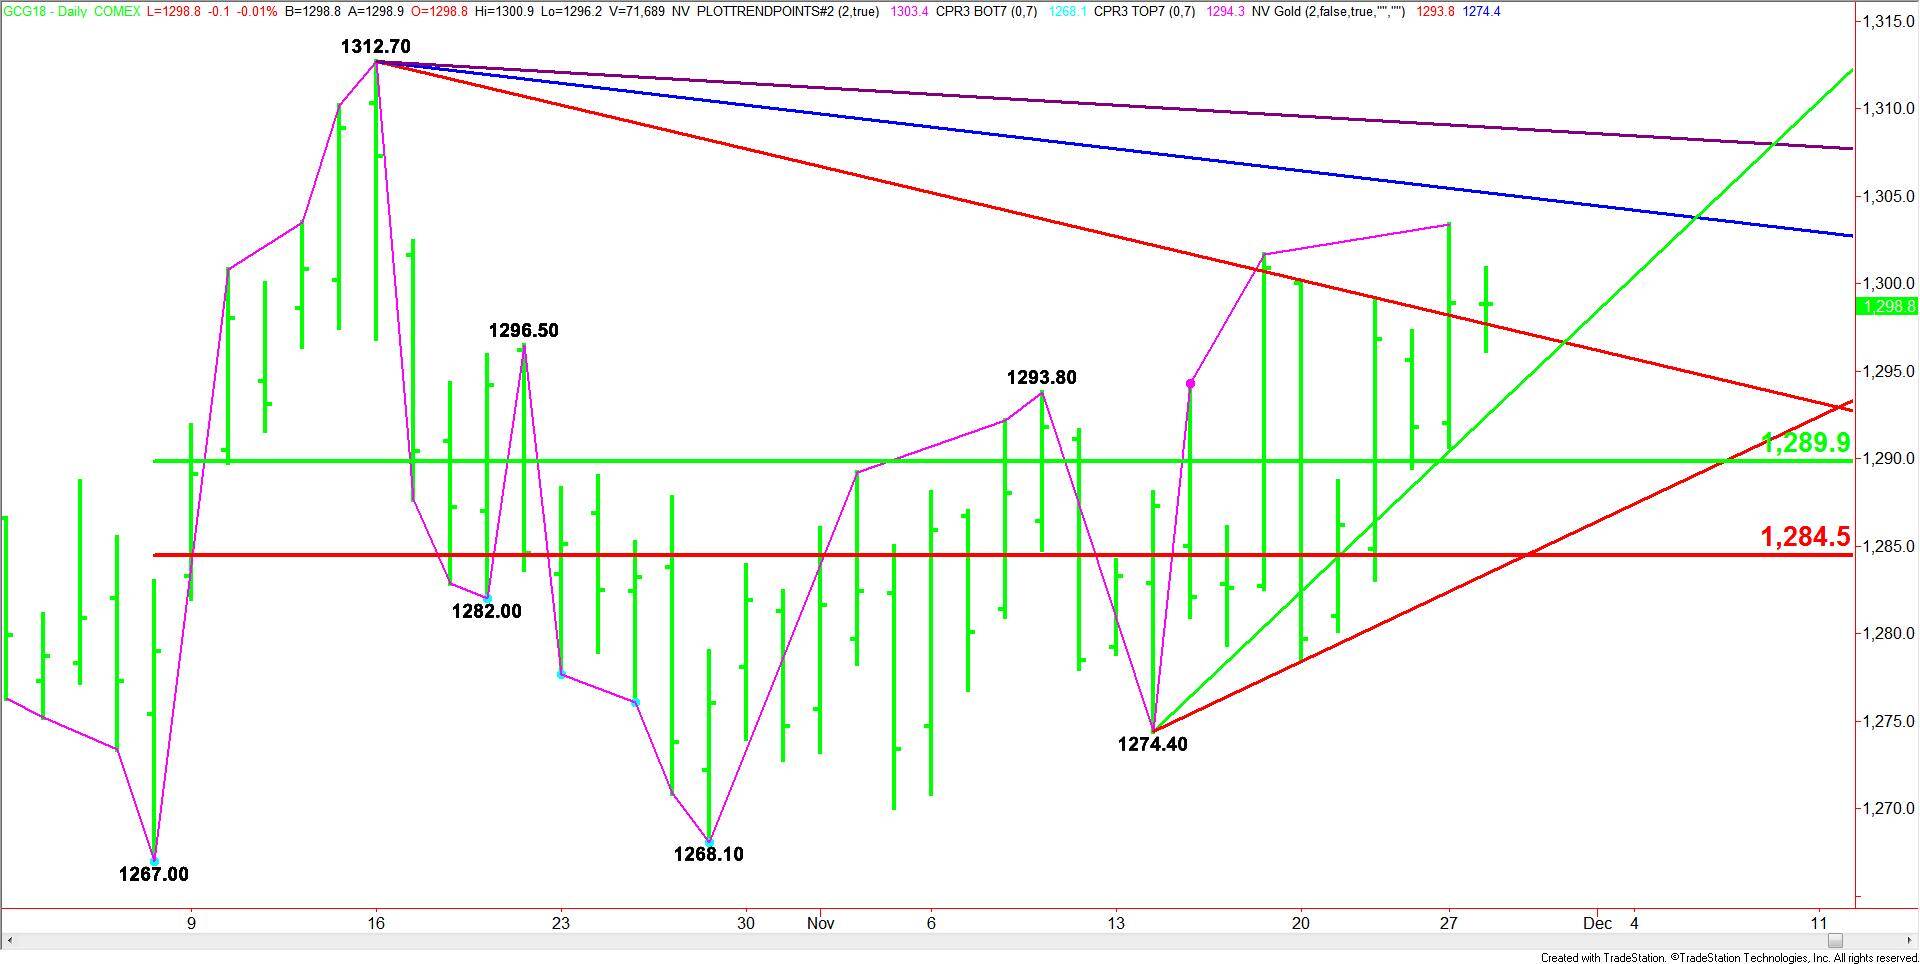
Daily Technical Analysis
The main trend is up according to the daily swing chart. The former top at $1283.80 is minor support. If the current rally gains traction then we could see a test of the next main top at $1312.70. A trade through $1274.40 will change the main trend to down.
The main range is $1267.00 to $1312.70. Its retracement zone at $1289.90 to $1284.50 is controlling near-term direction of the market. It should be considered support.
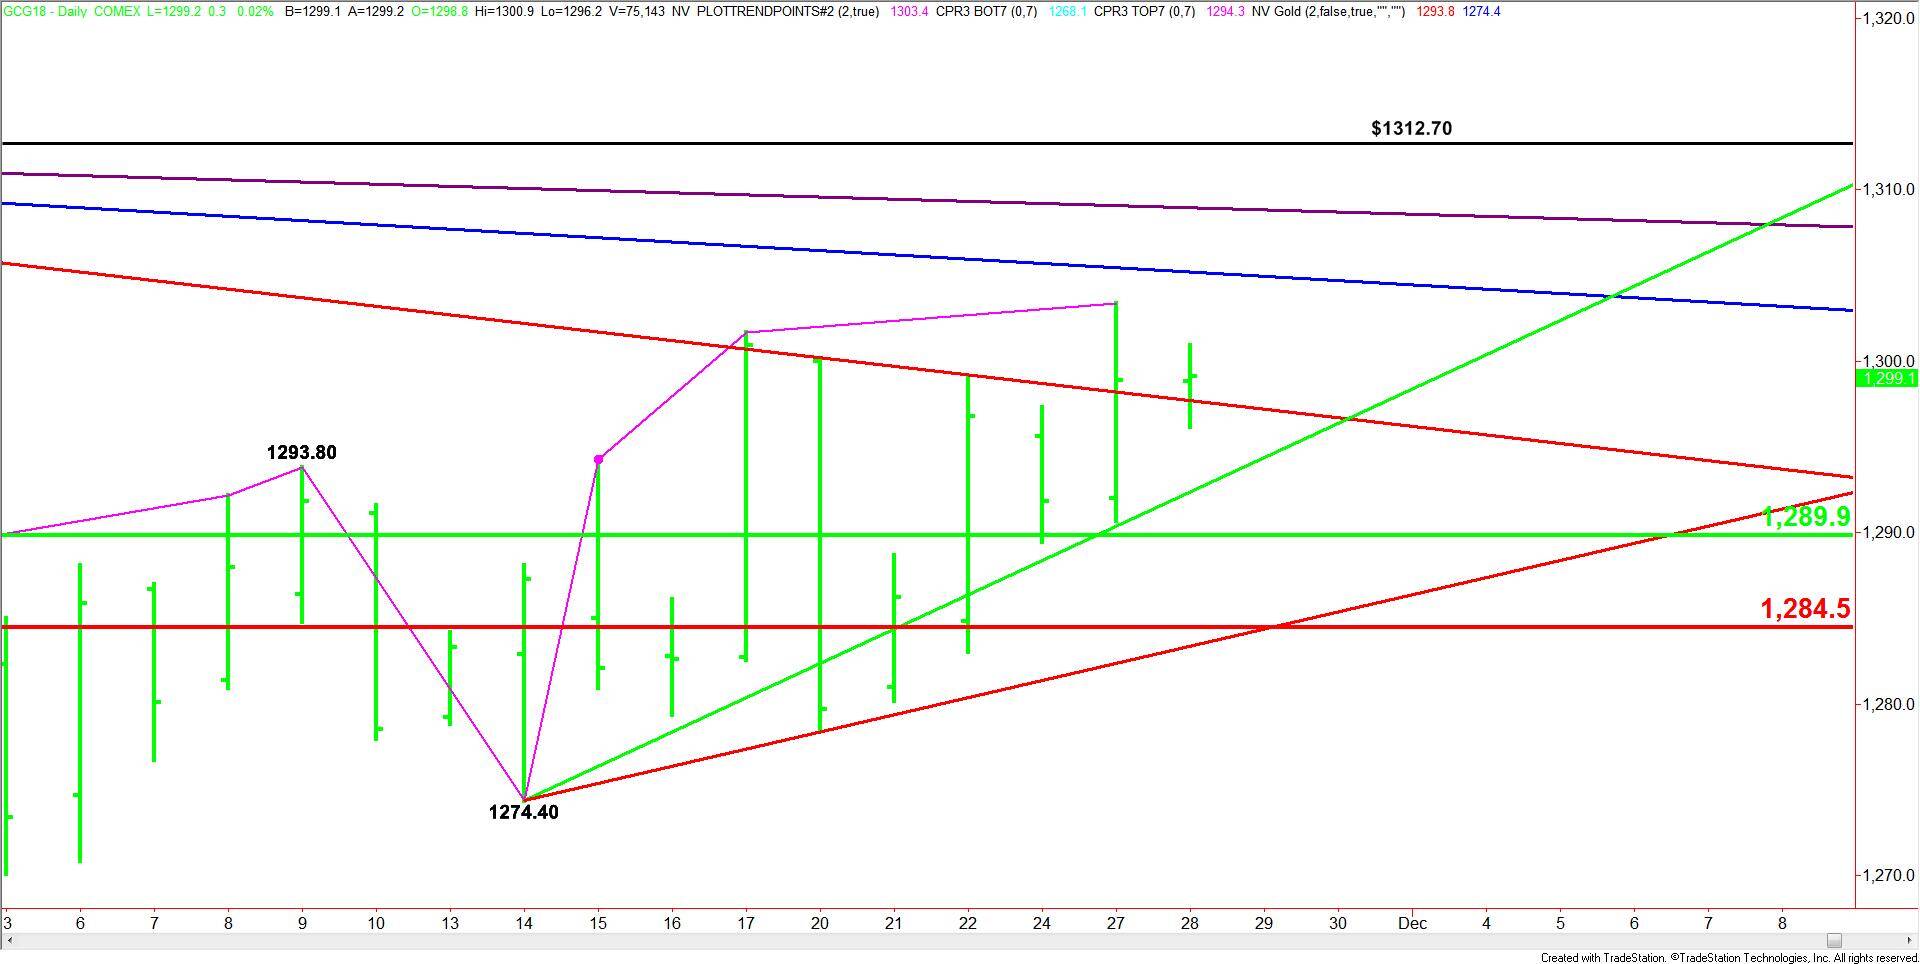
Daily Technical Forecast
Based on the current price at $1298.90 and the earlier price action, the direction of the gold market today is likely to be determined by trader reaction to the downtrending angle at $1297.70.
A sustained move over $1297.70 will indicate the presence of buyers. This could generate the upside momentum needed to challenge the next downtrending angle at $1305.20. Overtaking this angle will indicate the buying is getting stronger. This is the last potential resistance angle before the $1312.70 main top.
A sustained move under $1297.70 is likely to drive prices into the uptrending angle at $1292.40. Since the main trend is up, we’re likely to see a technical bounce on the first test of this angle.
If $1294.40 fails as support then look for the selling to continue into the 50% level at $1289.90. Once again, buyers could come in on a test of this level.
If $1289.90 fails, we’re likely to see an acceleration to the downside with the next targets $1284.50 to $1283.40.