



Gold closed lower last week but clawed back enough of the loss to suggest a short-term bottom had been reached especially since the buying began inside a major 50% to 61.8% retracement zone.
June Comex Gold futures settled the week at $1314.70, down $8.70 or -0.66%.
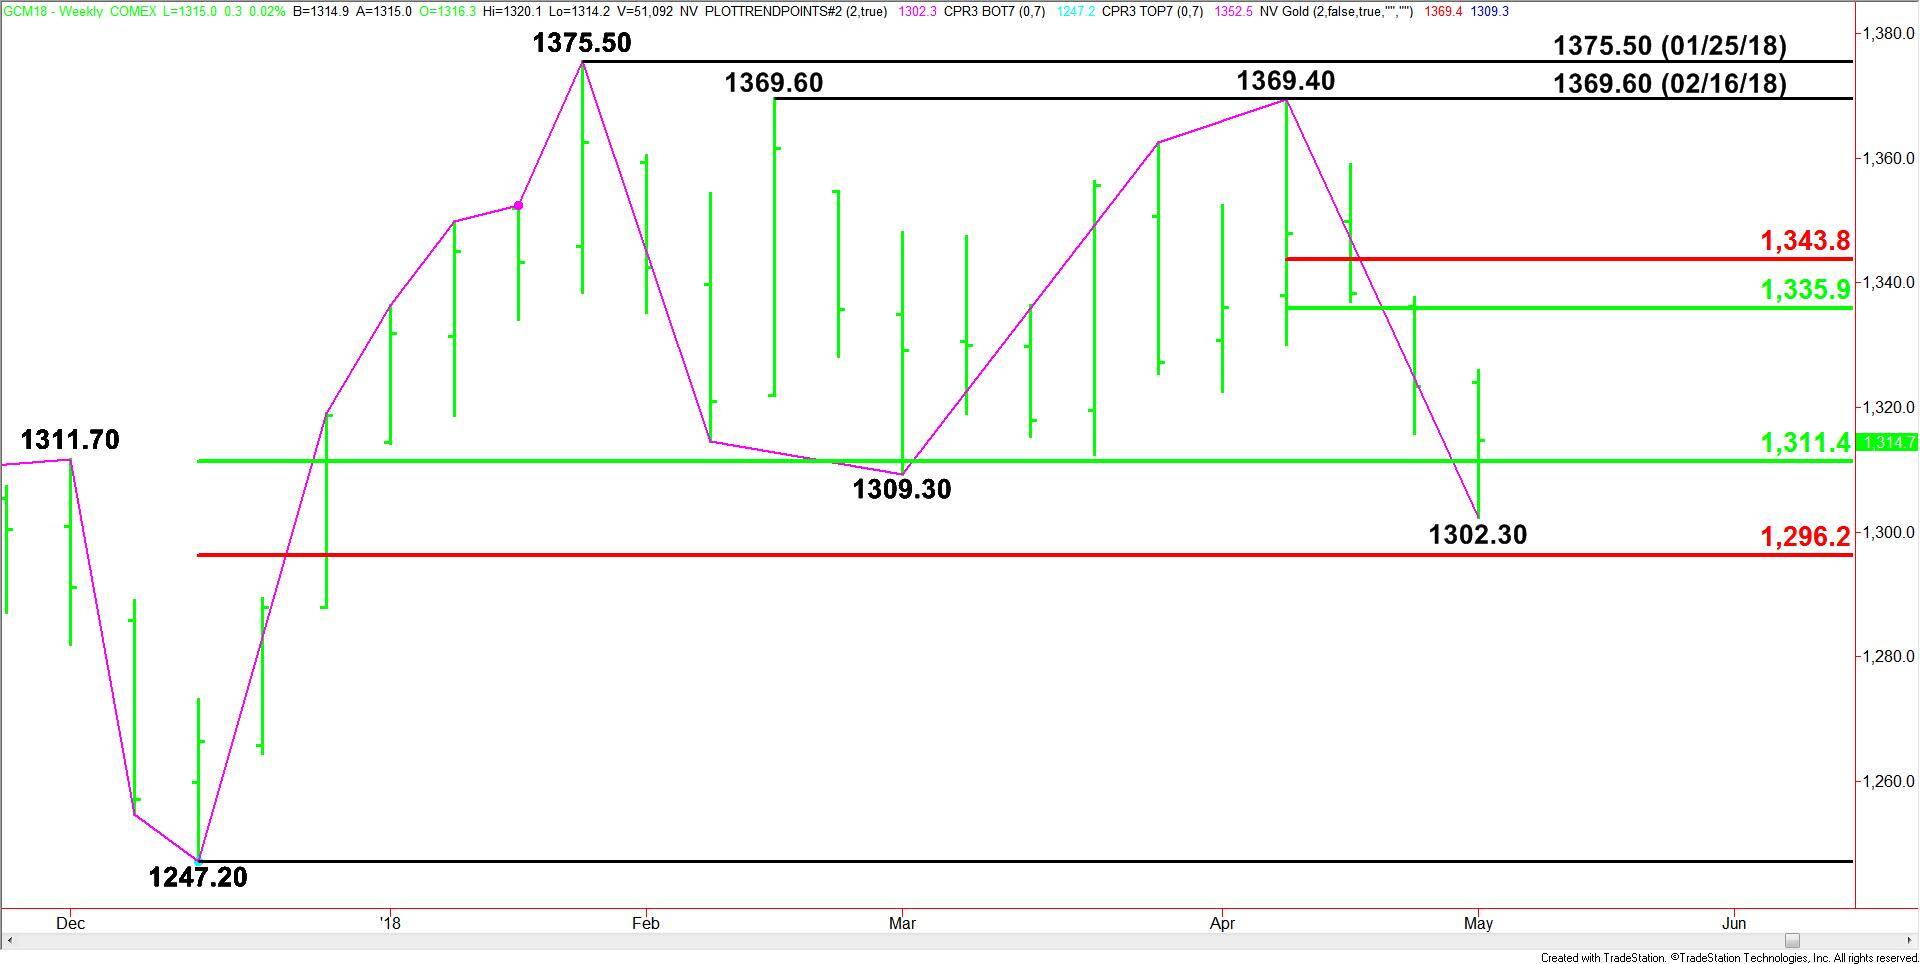
Weekly Swing Chart Technical Analysis
The main trend is down according to the weekly swing chart. The main trend turned down when sellers took out the previous main bottom at $1309.30 last week. The market isn’t close to turning the main trend to up, but there is room to the upside for a short-term retracement.
The main range is $1247.20 to $1375.50. Its retracement zone at $1311.40 to $1296.20 is controlling the near-term direction of the market.
The short-term range is $1369.40 to $1302.30. If there is a technical bounce then its retracement zone at $1335.90 to $1343.80 will become the primary upside target.
Weekly Swing Chart Technical Forecast
Based on last week’s close at $1314.70 and the price action, the direction of the gold market this week is likely to be determined by trader reaction to the main 50% level at $1311.40.
A sustained move over $1311.40 will indicate the presence of buyers. If this move generates enough upside momentum this week, we could see a move into the short-term retracement zone at $1335.90 to $1343.80. Since the main trend is down, sellers should show up on a move into this area.
A sustained move under $1311.40 will signal the presence of sellers. If this generates enough downside momentum, we could see a retest of last week’s low at $1302.30, followed by the Fibonacci level at $1296.20.
Watch for a technical bounce on the first test of $1296.20, but look out to the downside if this level fails since the weekly chart indicates there is plenty of room to the downside with the next major target coming in at $1247.20.