


Gold kicks off the week with two different things pulling in opposite directions. Elevated U.S. real yields increase the financing cost of holding gold, as it has no income, while gold continues to retain a high nominal value following an extended period of geopolitical and inflation uncertainty.
The latest official settlement was from Friday, listing December 2026 COMEX Gold at $4,074.90 per troy ounce, down $38.60 for the session. There are multiple reasons for this.
Real Rates Still an Issue
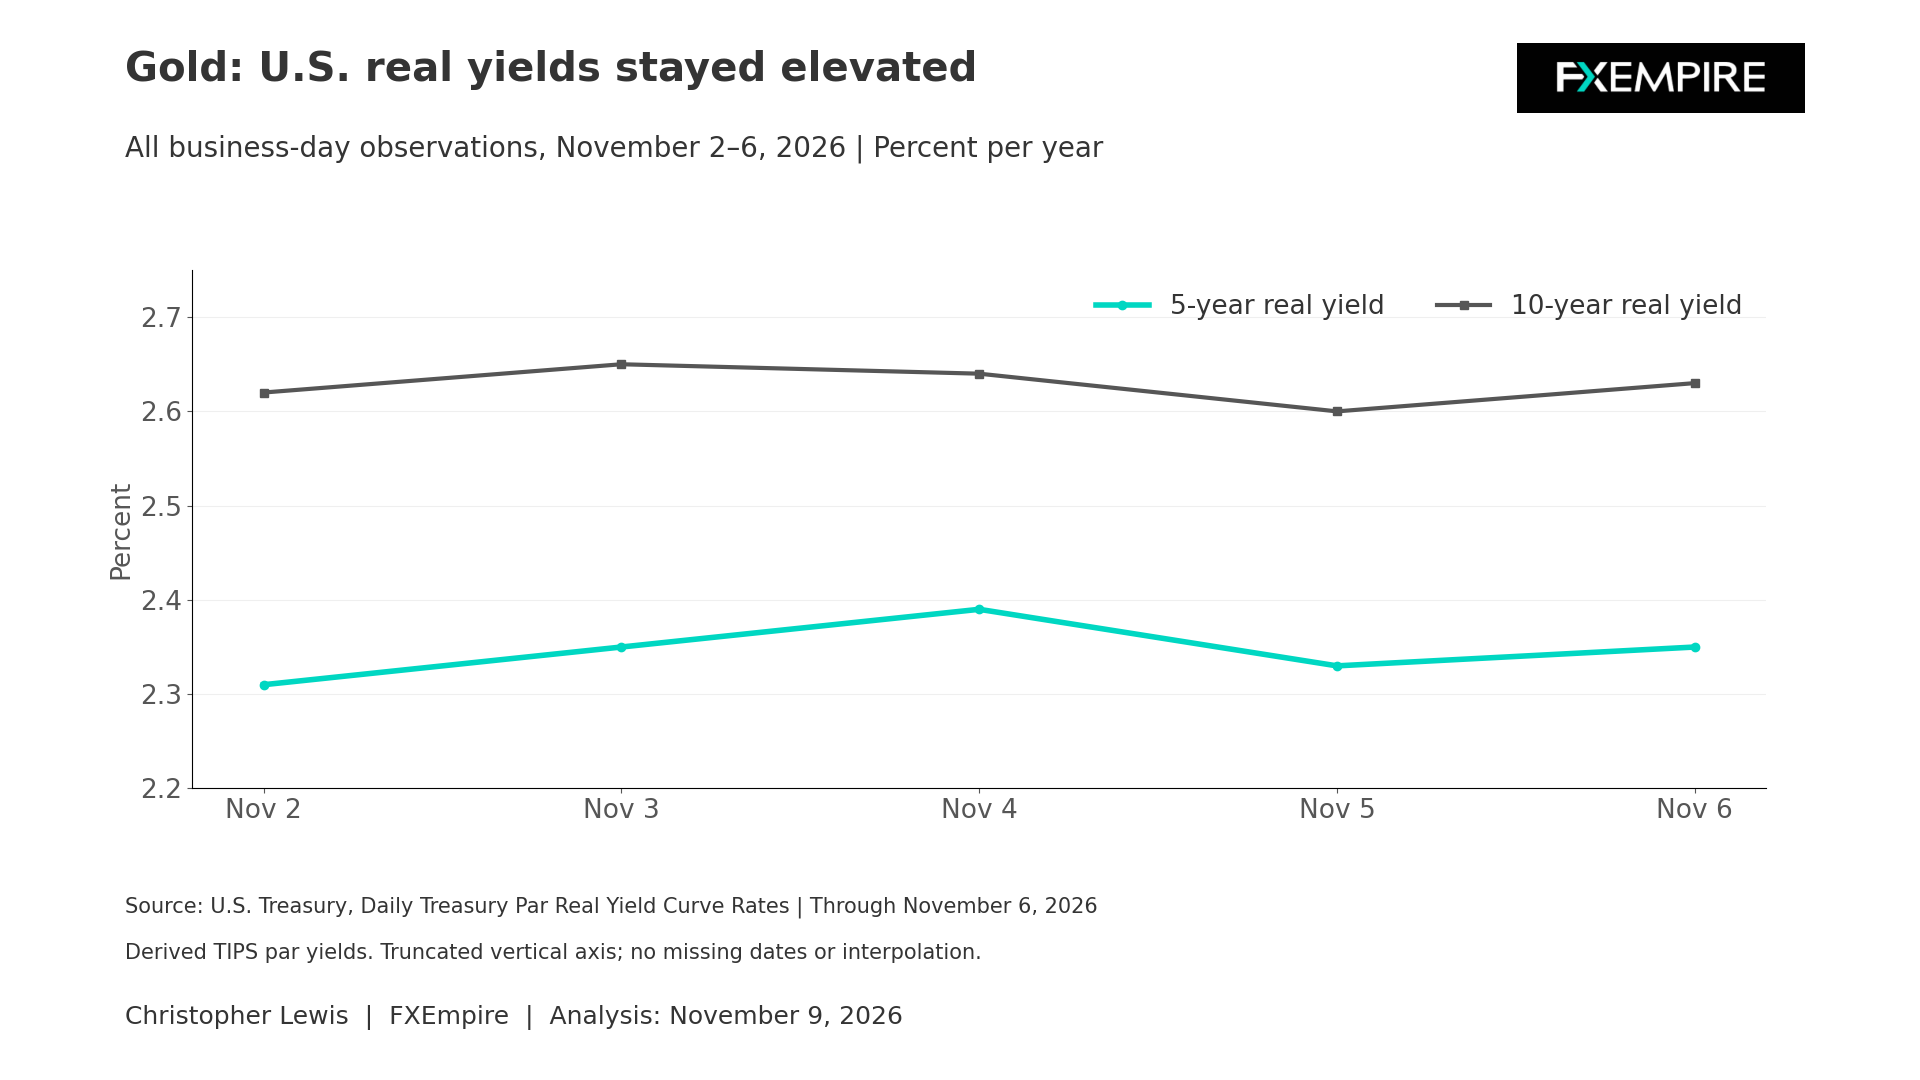
The real-rate backdrop remains somewhat restrictive. The U.S. Treasury placed the 5-year real yield at 2.35% and the 10-year real yield at 2.63% on November 6. Between November 2 and November 6, the 5-year measure remained between 2.31% and 2.39%, while the 10-year yield stayed between 2.60% and 2.65%. These are derived TIPS par yields.
Real yields do not have a fixed inverse relationship with gold, but they do represent a significant opportunity cost being paid. The shape of the curve also deserves attention. On November 6, the 30-year real yield was 3.07%, above the 20-year rate of 2.91% and the 10-year rate of 2.63%. This upward slope indicates that investors demanded progressively more inflation-adjusted return at longer maturities out of the U.S. Treasury.
For gold, the long end can influence portfolio allocation and the cost of maintaining defensive positions. A decline confined to just the shorter end of the curve would offer less support than a broad fall across the curve. On the other hand, a renewed rise in long-dated real yields could pressure gold even if immediate policy expectations remain somewhat stable.
NFP Surprised Last Week
Friday’s labor report supplied another policy input. The Bureau of Labor Statistics reported that nonfarm payroll employment increased by 165,000 in October and that unemployment was 4.1%. The still-expanding labor market could reduce pressure for rapid monetary policy easing, although payrolls alone do not determine Federal Reserve policy. The transmission to gold runs through policy expectations, Treasury yields, inflation compensation, and the dollar rather than directly through the employment figure.
Gold Price Forecast
Every new Gold analysis as it publishes, today's technical signal and key levels, live price — on one page.
See all Gold forecastsCPI up Next
The next major potential catalyst for gold could be the October Consumer Price Index, scheduled for Tuesday at 8:30 a.m. Eastern Standard Time. A higher inflation reading could support gold’s store-of-value narrative while also lifting yields if investors anticipate a firmer monetary policy path. A softer result could reduce nominal and real yields while weakening immediate demand for inflation protection. The result of this announcement will depend on which narrative dominates.
Productivity and Inflation
BLS also reported on October 5 that third-quarter nonfarm business productivity rose at a 3.6% seasonally adjusted annual rate. Output increased 3.7%, hours worked rose 0.1%, and unit labor costs declined 0.7% during the quarter, while remaining 2.4% higher than a year earlier. Strong productivity can allow output and wages to grow with less inflationary pressure.
The Technical Scenario for Gold Does Show Signs of Strength
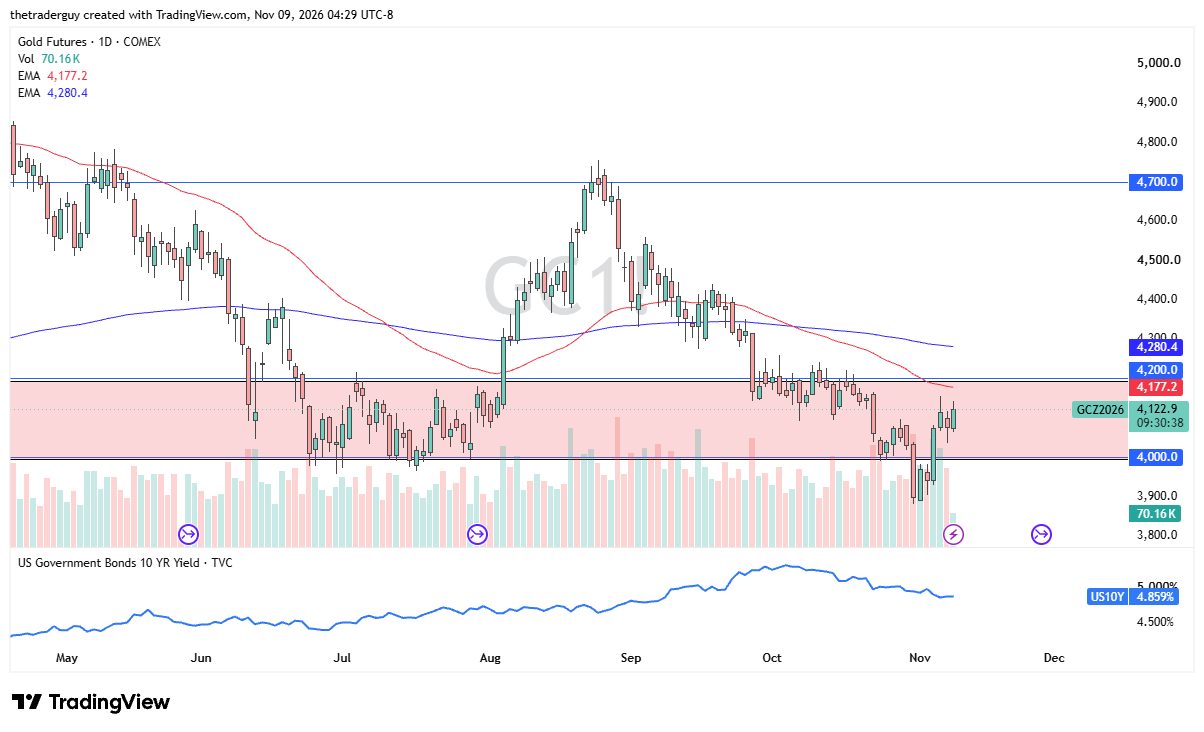
The near-term narrative therefore depends on whether real yields leave last week’s narrow, elevated range and how CPI changes the expected inflation-policy mix. Declining real yields, renewed official-sector demand, or worsening geopolitical conditions could strengthen the constructive case. Persistently high yields and resilient economic data weaken it.
The technical scenario for gold does show signs of strength, but I’m watching the $4,200 region because it has been significant resistance more than once. A daily close above that level could kick off the next leg higher. Until then, I assume that we are still very much in a range between $4,200 and $4,000.