Jobless claims fell more than expected
Gold prices tumbled on Thursday slicing through support level as US yields surged and the dollar gained traction. The move-in yields which was the largest rise in the past 3-years, comes as the jobs market continues to tighten. With rates unlikely to rise, and the bar to change interest rates becoming higher, yields could continue to back up. Bund yields also tumbled, moving in lockstep with the US treasury yield. Jobless claims continue to fall this week, suggesting that the labor market is continuing to tighten.
Trade gold with FXTM
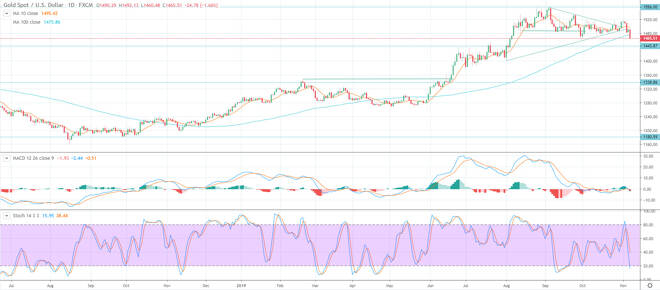
Gold prices tumbled Thursday as yields moved higher slightly through support near the 100-day moving average at 1,475, which is now seen as resistance. Support on the yellow metal is seen near the October lows at 1,426. Short term momentum has turned negative. The fast stochastic generated a crossover sell signal. Medium-term momentum has turned negative as the MACD (moving average convergence divergence) index generated a crossover sell signal. This occurs as the MACD line (the 12-day moving average minus the 26-day moving average, crosses below the MACD signal line (the 9-day moving average of the MACD line). The MACD histogram is printing in the red with a downward sloping trajectory which points to lower prices.
The Labor Department on Thursday reported that jobless claims decreased 8,000 to 211,000 for the week ended November 2. Data for the prior week was revised to show 1,000 more applications received than previously reported. Expectations were for claims to fall to 215,000 in the latest week. The four-week moving average of initial claims, increased 250 to 215,250 last week.
David Becker focuses his attention on various consulting and portfolio management activities at Fortuity LLC, where he currently provides oversight for a multimillion-dollar portfolio consisting of commodities, debt, equities, real estate, and more.