



Spot Gold Dips Ahead of NFP Report in Response to Higher Oil Prices
Spot gold is weaker early Friday as traders may be trimming long positions shortly before today’s U.S. Non-Farm Payrolls report, due to be released at 13:30 GMT. Higher oil prices may also be having an impact due to renewed concerns over inflation. Nonetheless, bullion is still poised to finish with its strongest week in over two months.
Gold could be supported later today if the NFP numbers line up with expectations, or if they come in weaker than the forecasts.
Weaker jobs data could ease the probability of future rate hikes, which would likely be supportive for gold. Nonetheless, it could still face headwinds because two Fed officials on Thursday said they thought small, steady rate hikes may be needed to cap inflation. Additionally, Goldman Sachs lowered its year-end price forecast to $4150 from $4650.
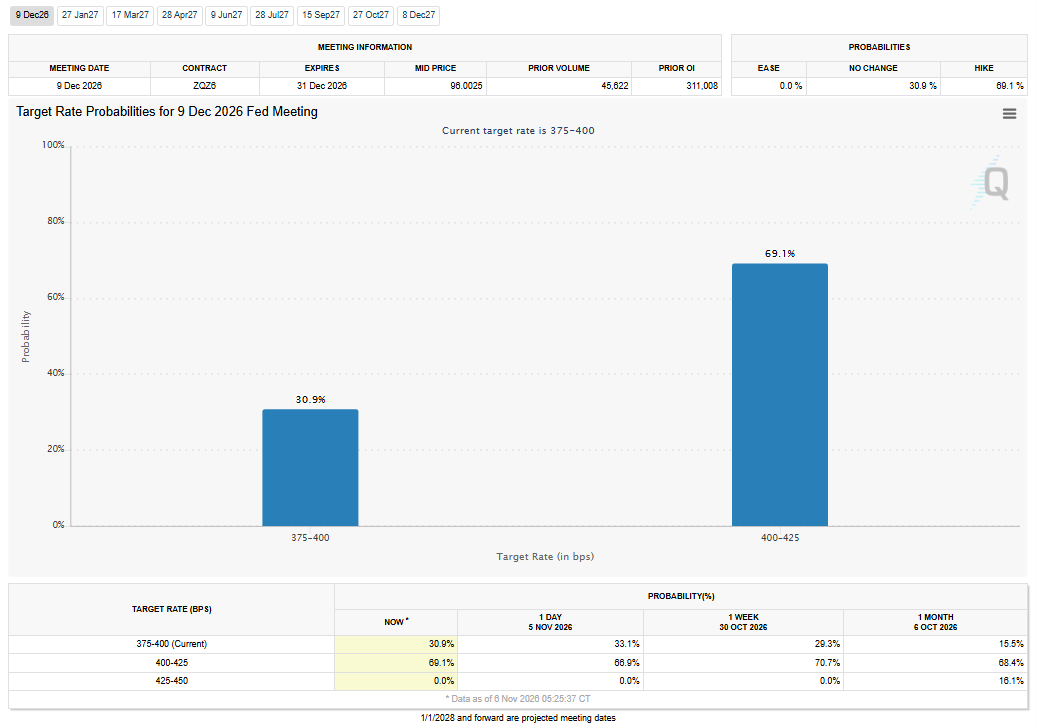
Over the intermediate-term, I expect oil prices, inflation, Treasury yields and Fed rate hike expectations to drive the price action in gold. Fed rate hike expectations for December are currently at 69.1%.
Daily Spot Gold (XAUUSD) Technical Analysis
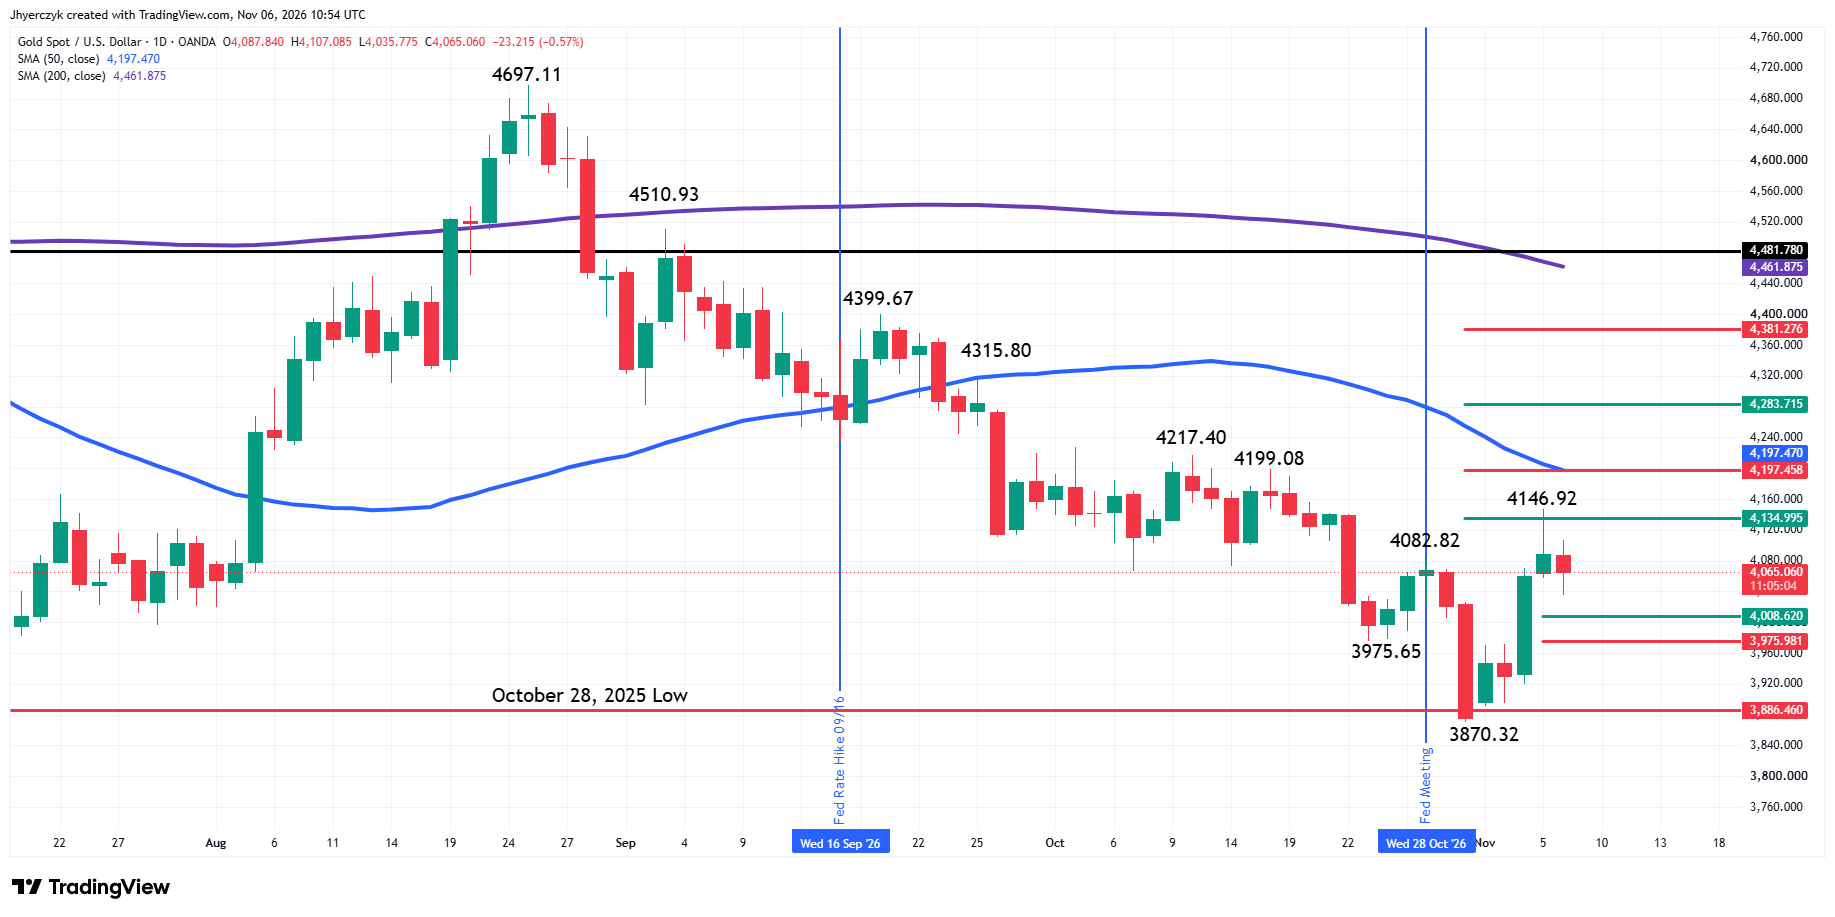
Spot gold is edging lower on Friday after posting a minor closing price reversal top the previous session. I’m calling it a minor reversal because it was formed on the fourth day up from the last swing bottom. Major reversals usually occur after seven-to-ten-day rallies. Although the price move was impressive, time did not satisfy my requirement for a prolonged move in terms of price and time. Nonetheless, the market could still be vulnerable to a near-term correction. Another way to look at it is that this type of pattern could lead to a 50% to 61.8% correction of the current rally, rather than a potential change in trend.
The main trend is up according to the daily swing chart. It turned up on Thursday when buyers took out the previous main top at $4082.82. A trade through $4146.92 will negate the minor reversal top and signal a resumption of the uptrend. The main trend will change back to down on a break under the previous bottom at $3870.32. Additional main top resistance comes in at $4199.08 and $4217.40.
The minor trend is also up, but today’s lower low has turned $4146.92 into a new minor top.
The short-term range is $3870.32 to $4146.92. Its retracement zone at $4008.62 to $3975.98 is a potential downside target.
The intermediate range is $4399.67 to $3870.32. Its retracement zone at $4135.00 to $4197.46 is resistance. It stopped the rally on Thursday at $4146.92.
The long-term range is $4697.11 to $3870.32. If the rally continues, then look for a near-term test of its retracement zone at $4283.72 to $4381.28.
Spot gold is also trading on the weak side of the 50-day moving average at $4197.47 and the 200-day moving average at $4461.88. Both indicators are resistance and potential trigger points for upside breakouts.
Gold Price Forecast
Every new Gold analysis as it publishes, today's technical signal and key levels, live price — on one page.
See all Gold forecastsWeekly Spot Gold (XAUUSD) Technical Analysis
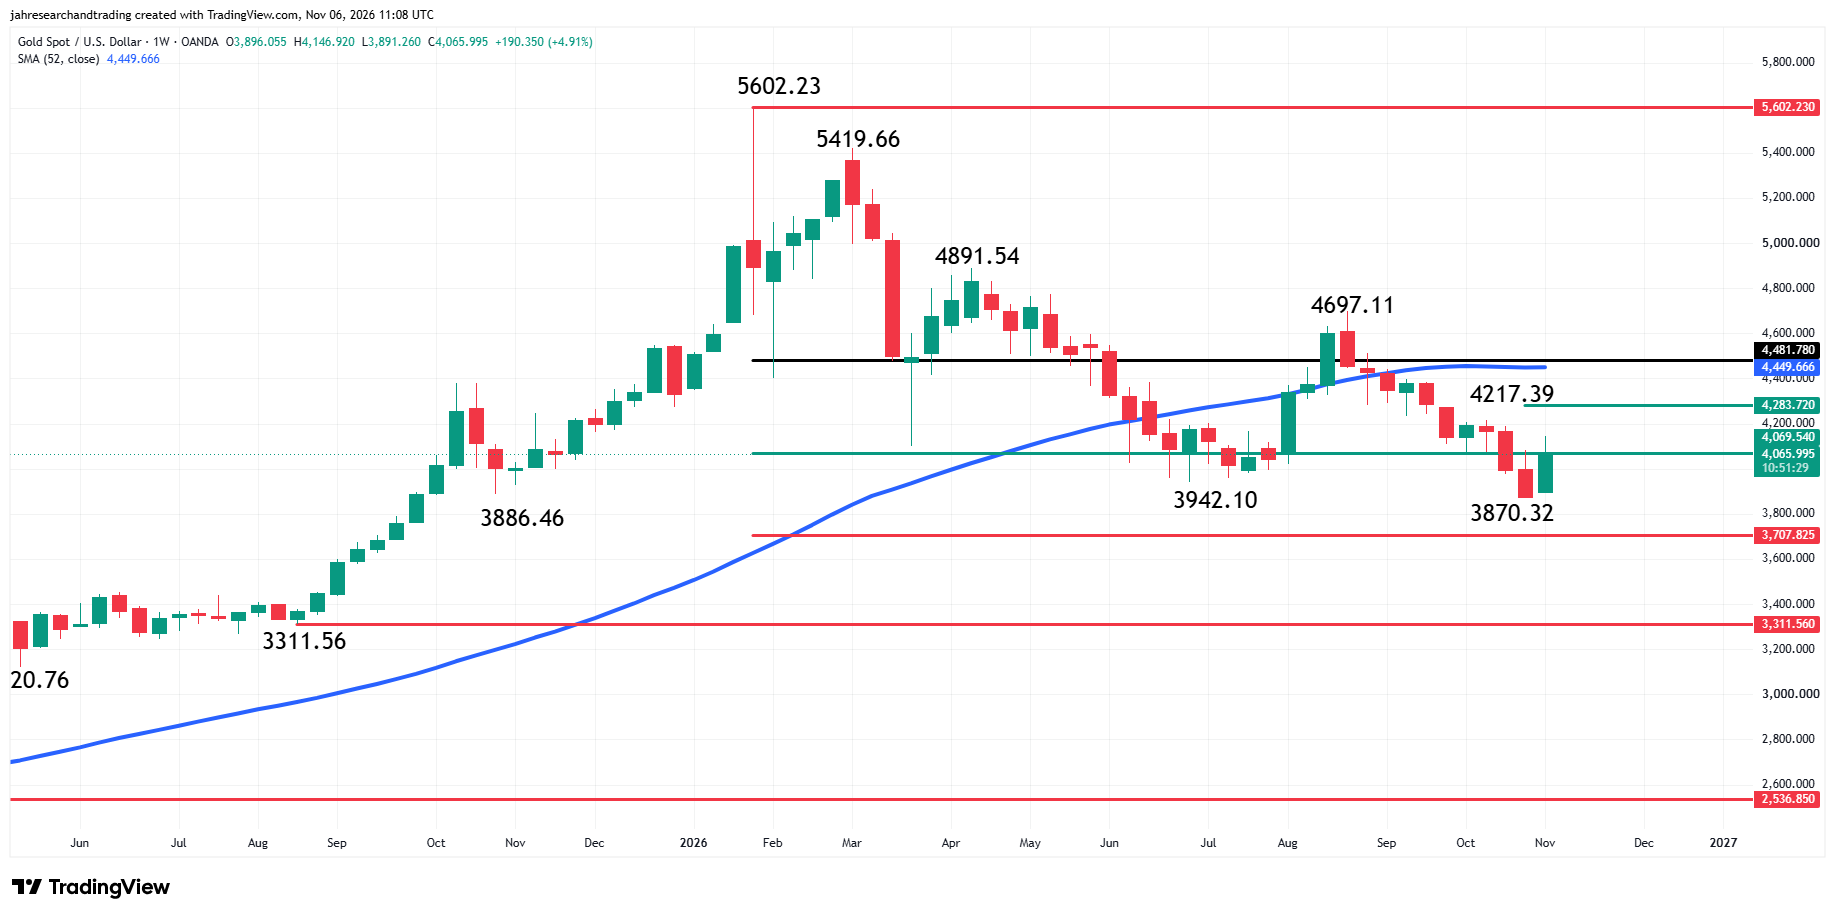
Spot gold is up about 5% on the weekly chart. Buyers came in early Monday, but sellers showed up on Thursday to stop the rally.
The main trend is down according to the weekly swing chart. The main trend will change to up on a trade through $4697.11. A trade through $3870.32 will signal a resumption of the downtrend.
The minor trend is also down. A trade through $4217.39 will change the minor trend to up. A new minor bottom has formed at $3870.32. The new minor range is $4697.11 to $3870.32. Its 50% level or pivot at $4283.72 is a new upside target. It forms a loose resistance cluster with the minor top.
The main range I am watching was formed by the November 2024 main bottom at $2536.85 and the January 2026 main top at $5602.23. As of early Friday, gold is straddling the upper level of its retracement zone at $4069.54 after a strong breakout over it the previous session fizzled at $4146.92.
Not only did it form a new minor bottom at $3870.32 by taking out last week’s high, but it is also testing the 50% level at $4069.54. A close over this level will put the market in a position to challenge the key minor top at $4217.39. A close under this price opens the door to a possible test of $3870.32.
Overtaking $4217.39 could create the upside momentum needed to challenge the 52-week moving average at $4449.67. This is followed by $4481.78, which is 20% down from the all-time high at $5602.23, the level that marks the start of the bear market.
What to Watch
Daily Spot Gold (XAUUSD)
With the main trend up on the swing chart, my bias has changed to cautiously bullish. The first test of this bias will be trader reaction to the retracement zone at $4008.62 to $3975.98. The first leg up from $3870.32 to $4146.92 changed the main trend to up, but the move may have been fueled by short-covering. A successful test of the retracement zone will indicate the presence of buyers if the market forms a secondary higher bottom. This would solidify my upside bias.
Taking out the upper level of the intermediate retracement zone at $4197.46 and the 50-day moving average at $4197.47 will be another sign of strength. This could create the momentum needed to challenge the long-term retracement zone at $4283.72 to $4381.28 and the 200-day moving average at $4461.88.
A failure to hold the lower level of the short-term retracement zone at $3975.98 will weaken my cautiously bullish outlook.
Weekly Spot Gold (XAUUSD)
My bias for Spot Gold on the weekly chart is still bearish because I haven’t seen the market overcome any significant resistance levels to convince me otherwise. The rally from the low at $3870.32 only indicates the market has stopped going down.
A close over $4069.54 will weaken my bearish outlook and could lead to a change in the minor trend to up. My longer-term outlook hinges upon trader reaction to the 52-week moving average at $4449.67.
If you’d like to know more about how to trade gold, please visit our educational area.