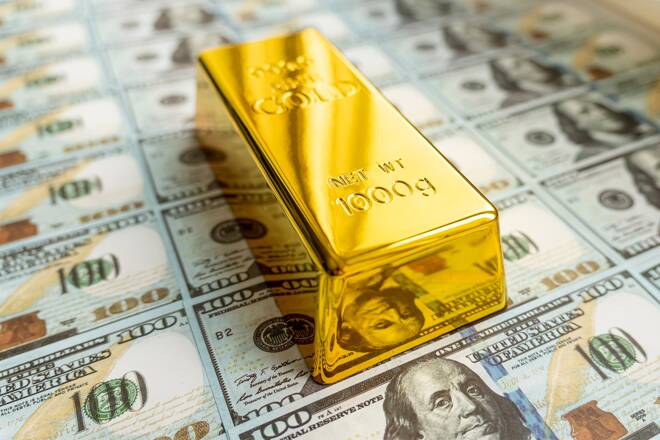
In a fluctuating market, Gold Fields sees a 9% production drop, impacting XAU/USD values and spot market dynamics.
Key Insights
Quick Fundamental Outlook
Gold Fields, an international gold producer, experienced a notable decrease in production in the third quarter of 2023. The company’s gold-equivalent production dropped by 9% year-on-year and 6% from the previous quarter. This decline was primarily due to issues in its Ghana and Australian operations.
Ghanaian mines, including Damang and Tarkwa, reported a 14% drop in production, while Australian output fell by 5-8% due to lower mining grades and operational challenges. In South Africa, production declined 8% year-on-year but improved 19% from the previous quarter.
The impact on precious metals was mixed. Gold prices steadied but halted their recovery rally after U.S. retail sales data exceeded expectations, generating uncertainty over U.S. monetary policy.
This data led to a rebound in the dollar and Treasury yields, applying pressure on gold prices. Despite recent soft inflation readings hinting at a potential end to the Fed’s interest rate hikes, the strong retail sales data reignited concerns about persistent inflation.
Higher interest rates tend to negatively impact gold as they increase the opportunity cost of holding non-yielding bullion, keeping gold prices below $2,000 an ounce.
In the case of copper, prices dipped following reports of continued weakness in China’s property market, a significant sector for copper demand. Although copper prices maintained most of their weekly gains due to resilience in China’s industrial production, the overall property market situation in China casts a shadow on copper’s demand outlook.
As of today, Gold trades at $1,964.280, marking a modest 0.24% increase over the last 24 hours. This movement is encapsulated within a 4-hour chart timeframe, presenting a detailed glimpse of the metal’s recent performance.
Key price levels to watch include an immediate resistance at $1,972, followed by subsequent resistances at $2,011 and $2,053. Support levels are currently pegged at $1,900, with further cushions at $1,857 and $1,814.
The Relative Strength Index (RSI) stands at 54, indicating a slight tilt towards bullish sentiment without veering into overbought territory. The MACD presents a more nuanced picture; though the MACD line (1.209) remains below the signal line (2.534), it suggests potential for upward momentum. The 50-Day Exponential Moving Average (EMA) at $1,961 aligns closely with the current price, hinting at a short-term bullish trend.
Chart analysis reveals a downward channel’s bullish breakout at $1,932, suggesting a buying trend is taking shape. This pattern, coupled with the observed technical indicators, points to a cautiously optimistic outlook for Gold.
In conclusion, the overall trend for Gold appears bullish, especially if it sustains above the $1,960 level. Short-term forecasts indicate a possible test of the $1,972 resistance in the coming days, with an eye on higher levels should the bullish momentum continue.
Silver exhibits a positive trajectory in today’s market, showing a 0.75% increase to $23.602 within the last 24 hours. The asset’s performance, closely monitored on a 4-hour chart, reveals significant price movements.
Key price levels identified include an immediate resistance at $23.70, with further barriers at $24.35 and $25.03. Meanwhile, support is established at $22.04, followed by lower levels at $21.47 and $20.72.
The Relative Strength Index (RSI) stands at 61, suggesting a bullish sentiment without entering overbought conditions. The Moving Average Convergence Divergence (MACD) exhibits a value of 0.072 against a signal line at 0.281, hinting at a potential bullish trend. The 50-Day Exponential Moving Average (EMA) is set at $22.87, indicating the asset is currently trading in a bullish zone above the 50 EMA.
Chart analysis shows a symmetrical triangle pattern, which extends resistance at $23.70, suggesting a continued bullish trend.
In conclusion, Silver currently shows a bullish trend, particularly if it maintains above the $22.80 pivot point. The short-term forecast anticipates the asset testing the resistance at $23.70 in the near future, with a potential to explore higher levels should the bullish momentum be sustained.
Traders and investors should watch these indicators and patterns closely to make informed decisions in this dynamic market.
Copper, a crucial industrial metal, has seen a marginal increase of 0.09% over the past 24 hours, reaching a price of $3.74765. This analysis, based on a 4-hour chart, highlights key price thresholds and technical indicators to forecast the metal’s trajectory.
Notably, copper has established a pivot point at $3.72, with immediate resistance looming at $3.77. Further resistance levels are set at $3.81 and $3.85, while support is found at $3.68, followed by $3.65 and $3.62.
The Relative Strength Index (RSI) currently stands at 59, leaning towards a bullish sentiment but not yet in overbought territory. The Moving Average Convergence Divergence (MACD) is 0.00351, with a signal of 0.01838, subtly suggesting a bullish trend. The 50-Day Exponential Moving Average (EMA) is at $3.70, reinforcing the bullish inclination as the price hovers above it.
Chart analysis identifies an upward channel, supporting the current bullish trend in copper. This pattern implies that the metal is likely to maintain its upward momentum.
Conclusively, the overall trend for copper appears bullish, especially if prices stay above the $3.70 mark. In the short term, market participants should anticipate copper testing the resistance levels, particularly at $3.77, which could lead to further bullish activity if surpassed. Investors and traders should closely monitor these technical indicators and chart patterns for potential trading opportunities in the dynamic commodities market.
For a look at all of today’s economic events, check out our economic calendar.
Arslan is a finance MBA and also holds an MPhil degree in behavioral finance. An expert in financial analysis and investor psychology, Arslan uses his academic background to bring valuable insights about market sentiment and whether instruments are likely to be overbought or oversold.