Gold Forecast Video for 10.05.23 by Bruce Powers
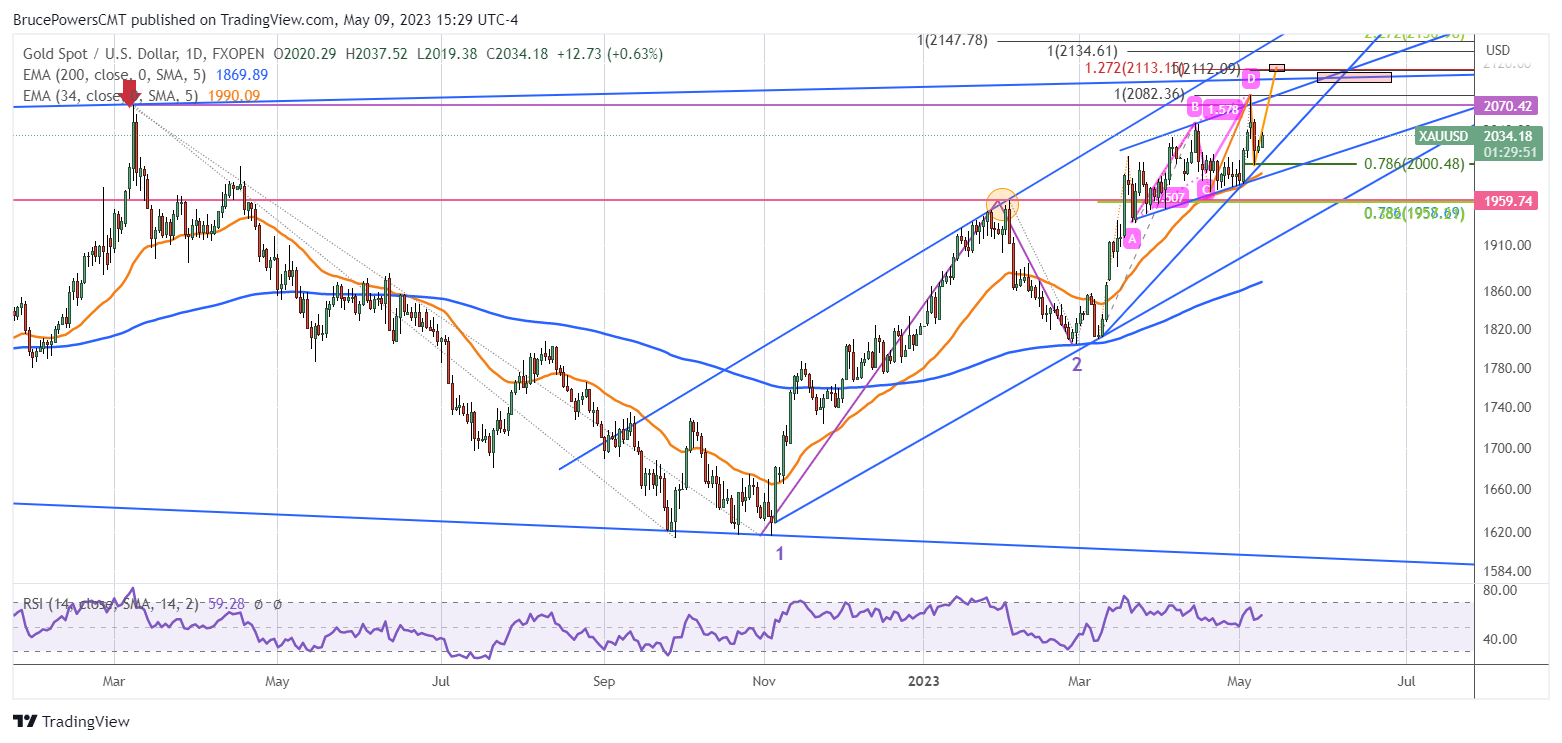
Following the completion of an ABCD pattern at last week’s 2,084 high, gold retraced to a 78.6% Fibonacci level with a low of 1,999. That low is now key near-term support. A drop below it though should find support relatively quickly at one of the two internal uptrend lines drawn on the chart. Just above the lower and more critical trendline is the 34-Day EMA at 1,990. A daily close below the 34-Day EMA is a sign of weakness that could lead to an accelerated downside move.

Ascending Trend Channel and Rising Wedge Pattern
Gold continues to progress higher in an ascending trend channel. If it remains above last week’s low, it has a chance to evolve higher. The top trendline of the channel is the initial target with a maximum level of 2,102. That is because if gold exceeds that high it would have broken through one of the two uptrend lines that currently mark its boundaries in the shape of a rising wedge. Importantly, the rising wedge is contained within the parallel channel, which also needs to be considered.
2,102 Beginning of Next Target Zone
Around 2,102 is where the three lines intersect. The two lines just mentioned plus a trendline across the top of a large expanding triangle that’s been forming for more than two years (best seen in weekly or monthly chart). There is also the completion of a new ABCD pattern at around 2,112. For the new pattern the C leg starts at the 1,999-swing low from last week.
If 1,999 Support Holds, Gold Should Go Higher
The bottom line is that the 2,102 to 2,112 target zone is in sight if the 1,999-support zone is not busted. If it is, watch for price to be rejected at one of the lower interest uptrend lines or 34-Day EMA. If instead price breaks below the support levels represented by the lines, then a deeper retracement is likely. In that case, the uptrend line at the bottom of the large ascending trend channel should act as support at a maximum. Nevertheless, the 38.2% retracement at 1,959, that previously saw support will be the first level below the lines to watch price action.
For a look at all of today’s economic events, check out our economic calendar.