


The latest financing signal for gold is modest easing in longer-term real yields. The Treasury 10-year par real yield declined to 2.77% yesterday from 2.80% the day before. It remains above the October 16 reading of 2.74% but below the 2.88% recorded on October 13. Tuesday, therefore, reversed part of Monday’s rebound without establishing a straight-line trend.
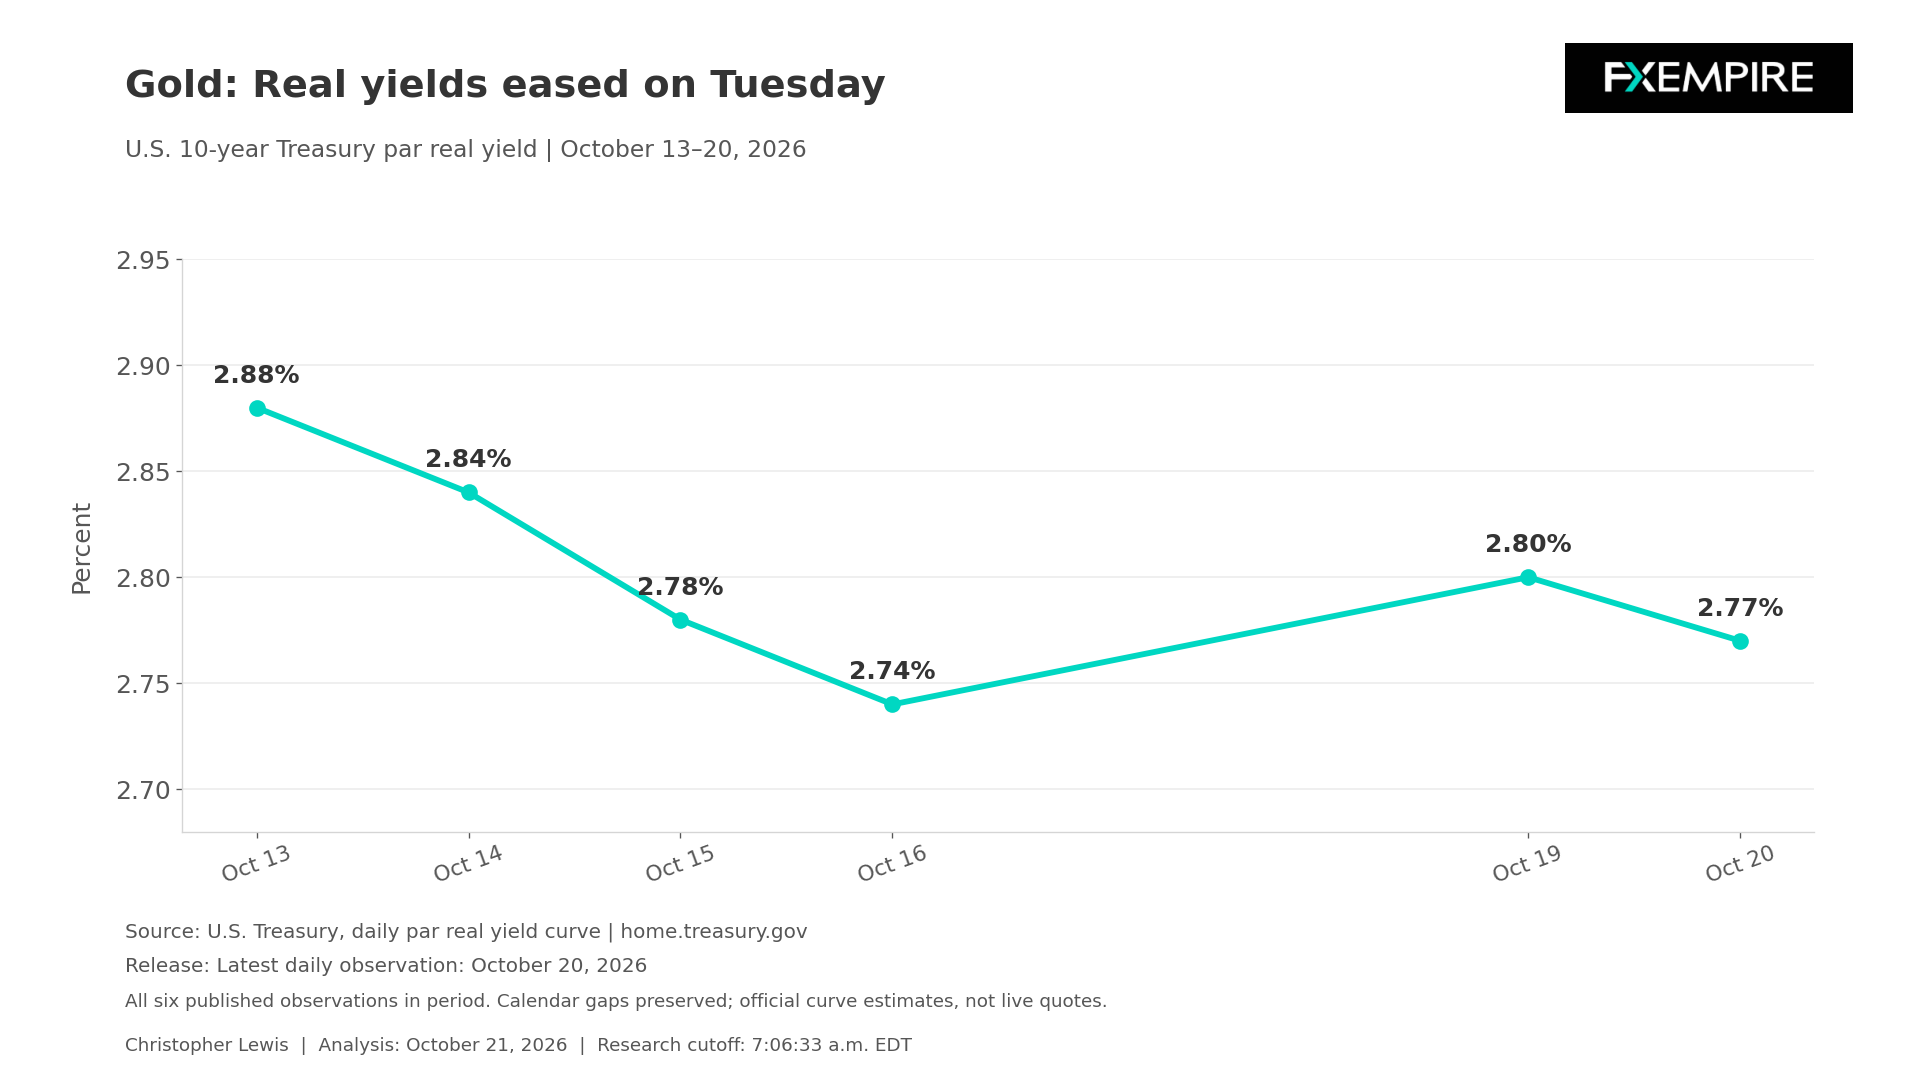
For bullion, lower inflation-adjusted government returns can reduce the opportunity cost of holding an asset without any yield. Tuesday’s move is a slight improvement in that part of gold’s backdrop. Its size and short duration argue against declaring a massive victory here, but it is the beginning of what we want to see.
Nominal Rates
Nominal rates also show why the phrase “yields fell” needs a little bit of qualification. The 10-year Treasury par yield declined to 5.12% from 5.15% on Monday, but the 2-year increased to 4.79% from 4.77%. The market did not experience uniform easing across maturities. That combination is consistent with different pressures on near-term policy-sensitive rates and longer-term financing conditions.
The distinction between nominal yields, real yields, and published inflation is important here. A Treasury Inflation-Protected Securities real yield reflects the market pricing of an inflation-linked security. Subtracting last month’s CPI rate from a nominal yield would instead mix a backward-looking inflation measure with a forward-looking return.
Housing and the Economy
A fresh growth-related release provides context. Census and HUD reported on October 20 that September housing starts were at a seasonally adjusted annual rate of 1.221 million, a point estimate 5.2% below revised August. The uncertainty interval around that monthly change was plus or minus 11.8 percentage points, so the estimated decline was not statistically distinguishable from zero. Housing permits were at a 1.4 million annual rate, down 0.2% monthly.
For gold, the relevance is the tension between economic resilience and restrictive financing. Softer rate-sensitive activity can encourage expectations of eventual policy relief, but one noisy housing estimate is not going to be enough to establish some type of economy-wide downturn. It does not prove that the housing release drove Tuesday’s bond move.
Gold Price Forecast
Every new Gold analysis as it publishes, today's technical signal and key levels, live price — on one page.
See all Gold forecastsInflation remains the competing constraint. September CPI, released on October 14, rose 0.6% month-over-month on a seasonally adjusted basis and 3.7% over 12 months before adjustment. Core CPI increased 0.3% monthly and 2.6% annually. September final-demand PPI, released on October 15, increased 1.3% monthly and 6.3% annually before adjustment.
These readings create two possible channels for gold. Concern about purchasing power can strengthen demand for protection at times, while a forceful monetary response can raise the return available on competing assets. Producer price increases do not necessarily need to completely pass into consumer inflation. Margins and demand will have an influence on that process. An inflation figure, therefore, cannot be translated mechanically into a bullish or bearish bullion forecast.
Federal Reserve Meeting
The next scheduled Federal Reserve meeting is October 27 and 28. That decision remains ahead, and no outcome is assured here, although most of the market is looking at the Federal Reserve holding interest rates. December is still priced in at about an 80% chance of a 25-basis-point rate hike.
The chart below shows the 10-year real yield observation from October 13 through October 20, with gaps preserved. It is worth noting that last Monday was a holiday, so a little bit of “catch-up” may have been going on here as well.
Technical Analysis
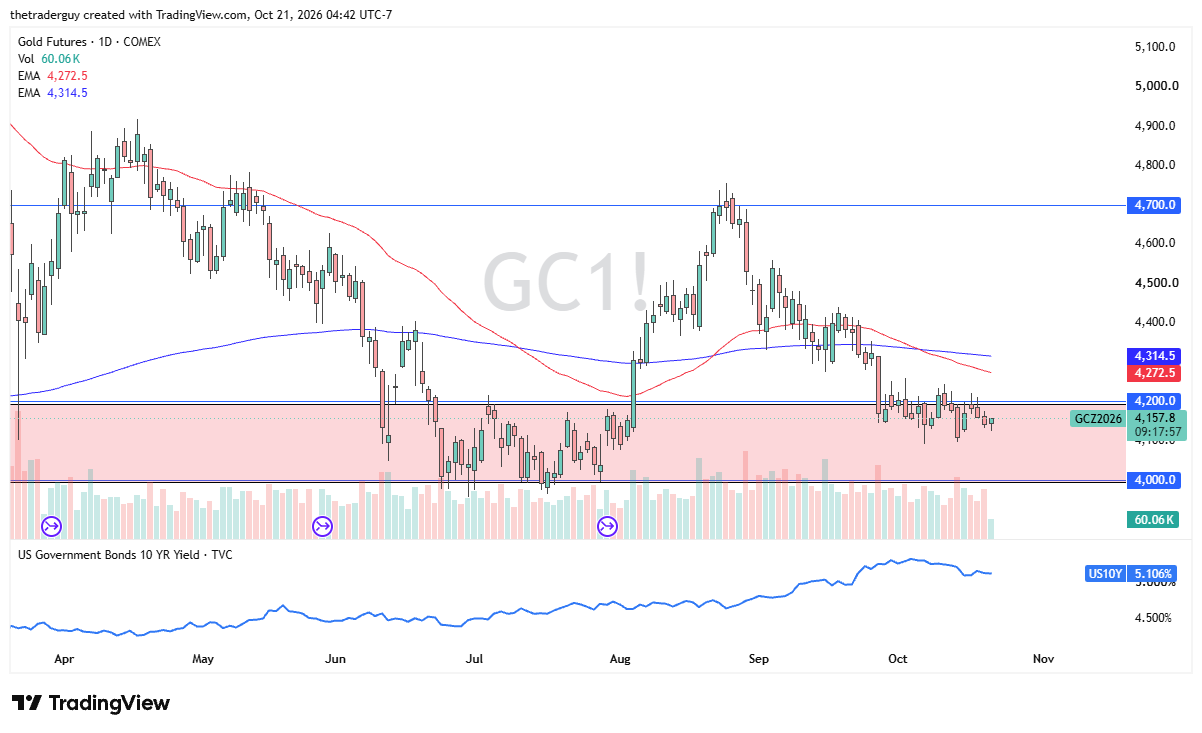
From a technical analysis standpoint, it looks like gold is trying to find some type of bottom at the top of the overall demand range that we had seen in the middle of summer. As things stand right now, it looks like yields are essentially sideways, and if that remains the case, gold probably follows suit.