


The precious metal has been under considerable selling pressure, with investors reassessing expectations for Federal Reserve monetary moves and the direction of the U.S. dollar as a result.
Massive Drop This Week
According to Friday reporting, gold had fallen approximately 8% during the week, putting it on course for its largest weekly decline since March. The metal also reached its lowest level in more than a year. These figures describe trading as brutal, to say the least, and now we see the market looking at the $3,500 level for potential support.
The technical deterioration has been particularly noticeable over the last several sessions. On November 16, the CME Group reported gold futures trading near $3,852 after breaking below the $4,000 and $3,900 region. By November 18, December gold futures had slipped below $3,800, reaching roughly the $3,757 level. The following session then brought another decline, with CME reporting an intraday low of $3,668.40 on Thursday. Friday has seen more of the same.
These figures are closing prices for the COMEX and give you an idea of just how rapidly we have fallen off. On the weekly time frame, the market has created a difficult environment for buyers. The $3,700 to $3,800 region becomes an important area to monitor if gold attempts to recover. It previously had attracted a considerable amount of activity, but the breakdown suggests sellers could return if the market rallies into that region. Above there, then you have to worry about the $3,900 level and, of course, the $4,000 level. Neither level guarantees resistance, but the way they have behaved on the way down is worth noticing.
Federal Reserve Expectations Continue to Create a Lot of Pressure on Gold
The most important fundamental development is the changing outlook for U.S. interest rates. The Federal Reserve released the minutes of its October 27 and October 28 meeting on November 18. Those minutes revealed that nearly all participants expected additional increases in federal funds rates to be appropriate under the baseline economic outlook.
Gold Price Forecast
Every new Gold analysis as it publishes, today's technical signal and key levels, live price — on one page.
See all Gold forecastsThe minutes represented discussions from October rather than new monetary policy decisions, but nevertheless, they reinforce the impression that policymakers remain very concerned about inflation and are prepared to remain restrictive with financial conditions. Obviously, the bond market will show similar behavior.
Treasury Yields
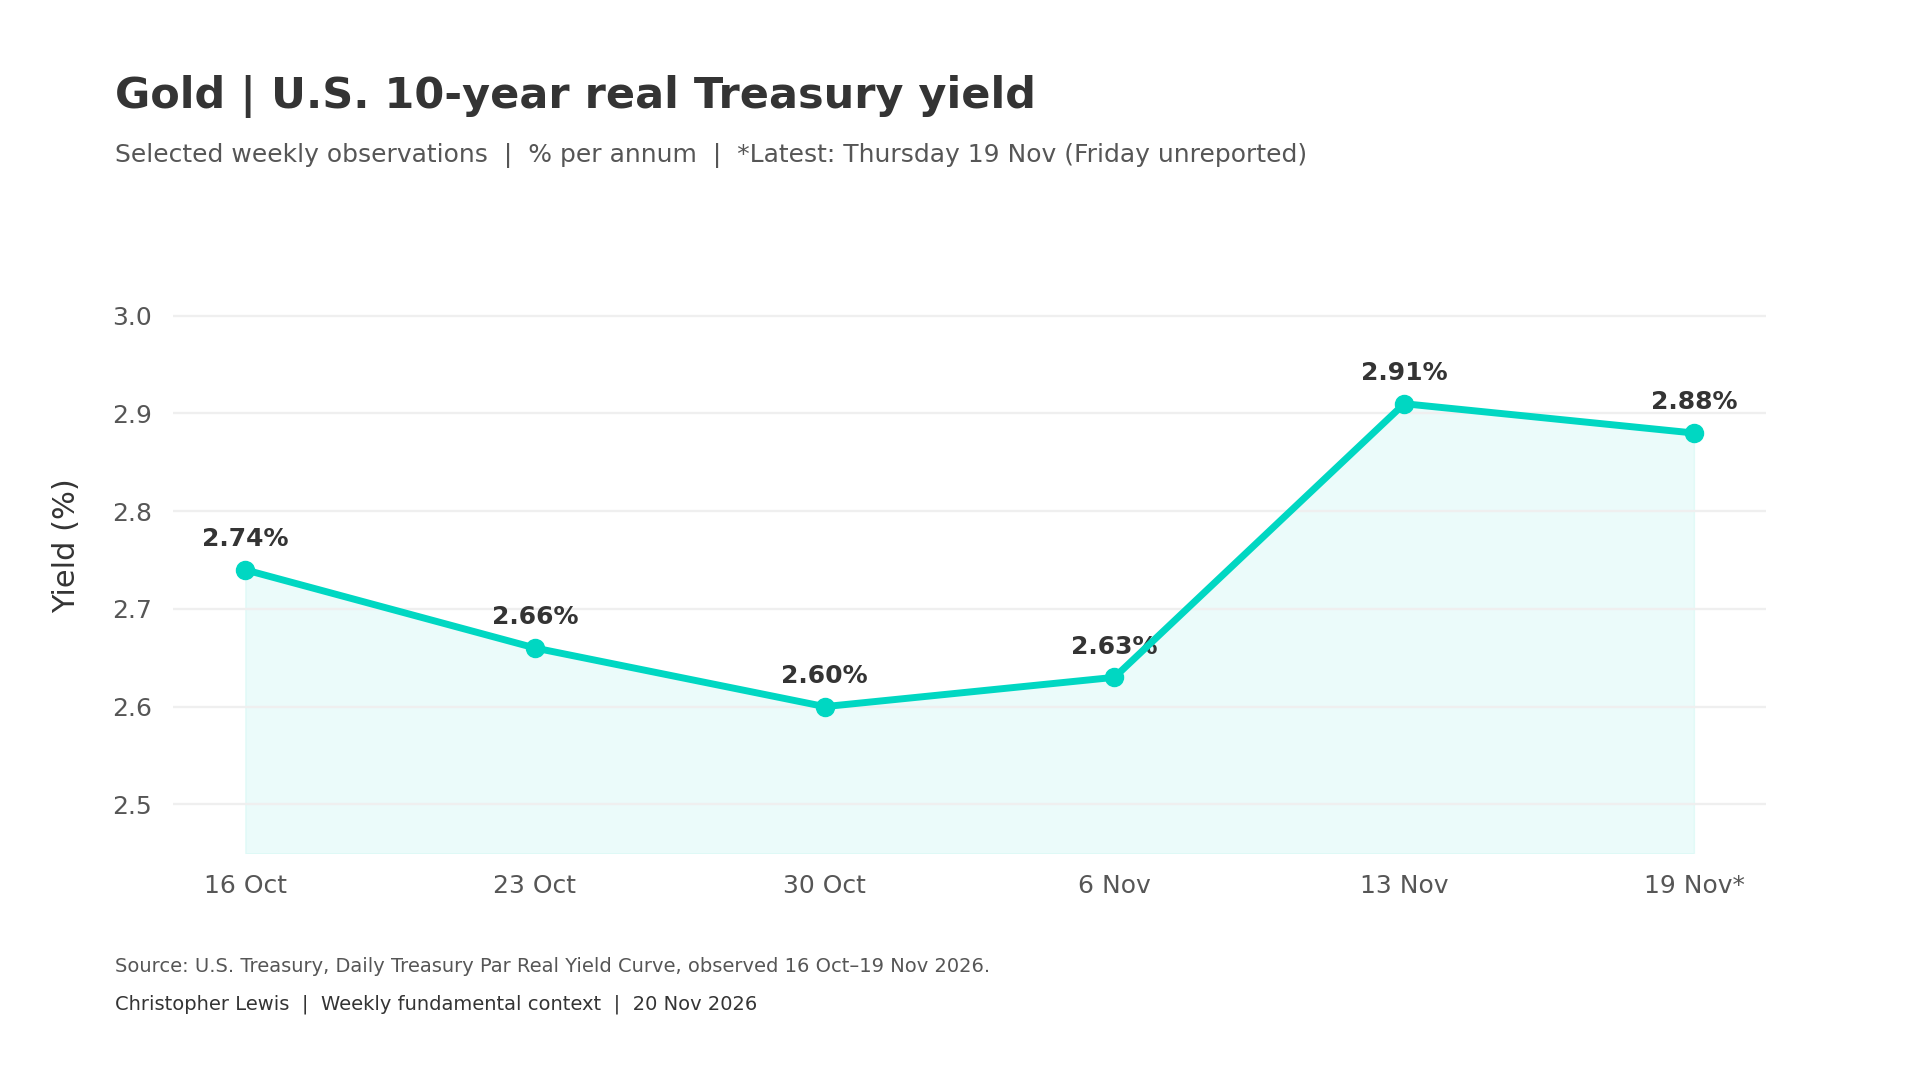
The official U.S. Treasury figures show the 10-year real yield increasing from 2.63% on November 6 to 2.91% on November 13. By November 19, the yield had eased to 2.88%, but it remained substantially above the level from two weeks ago. For gold investors, this represents a meaningful increase in the opportunity cost of holding a non-yielding asset such as gold.
The dollar, of course, has also been strengthening. On Friday, the U.S. dollar is approaching its strongest level since April 2025, with the currency heading for a fourth weekly advance. The combination of a stronger dollar and elevated real yields has made the environment particularly difficult for precious metals.
ETF Inflows
There is an interesting distinction between the futures market decline and broader investment activity, though. In its November 16 Weekly Markets Monitor, the World Gold Council reported approximately $673 million in net gold ETF inflows for the week ending November 13. The covered funds also recorded an estimated 2-ton increase in holdings. These results are particularly noteworthy because they show that investment demand remained positive across the monitored funds despite the weakness in the gold market. However, these figures refer to the previous reporting week. They do not establish what has happened in this latest sell-off.
Central bank demand provides another source of longer-term support. According to the World Gold Council’s November 17 update, the People’s Bank of China added 26 tons of gold during October.
Negative Outlook Overall
The broader weekly picture, though, remains negative. The market has surrendered several important price areas, while the fundamental environment continues to favor the U.S. dollar and interest-bearing assets. A recovery would become more credible if gold could begin reclaiming previously broken regions and, perhaps even more importantly, real yields stopped reinforcing the bearish argument. On the other hand, rallies that repeatedly fail beneath previous support would suggest sellers remain firmly in control.
The next major economic development will be the October personal income and outlays report, scheduled for Wednesday, November 25, at 8:30 a.m. ET. The report includes the Federal Reserve’s preferred PCE inflation measures. A softer-than-anticipated inflation reading could give gold bulls the possibility for more room to recover. A stronger reading increases the downward pressure.
Technically Weak
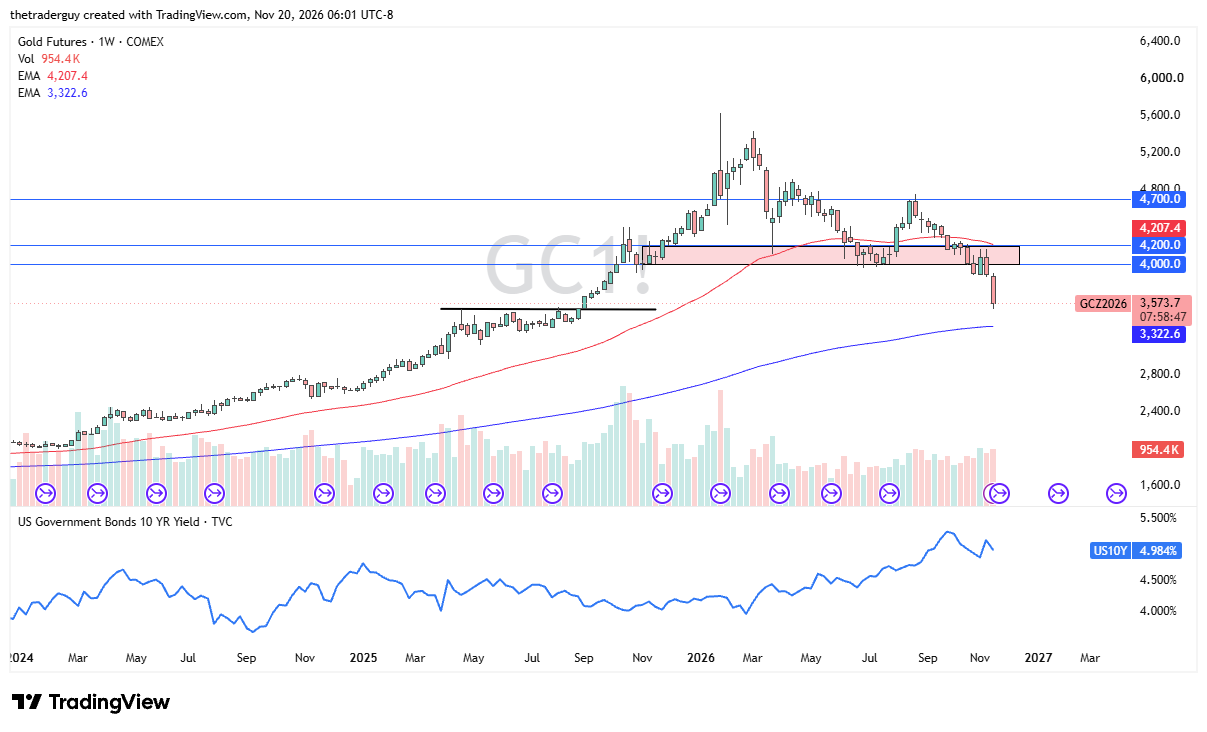
Looking at the charts, it appears that we are threatening the $3,500 level as we jump into the weekend. Quite frankly, this looks like a fade-the-rally type of situation just waiting to happen. If the market were to break down below the $3,500 level, at that point I’ll be looking to see whether or not we can get to the $3,300 level.
But keep in mind that, more importantly than the charts, it’s the real yields in America. If they start to drop, that could be a positive sign for gold. Until then, I’m not willing to buy it.