Tuesday’s Action
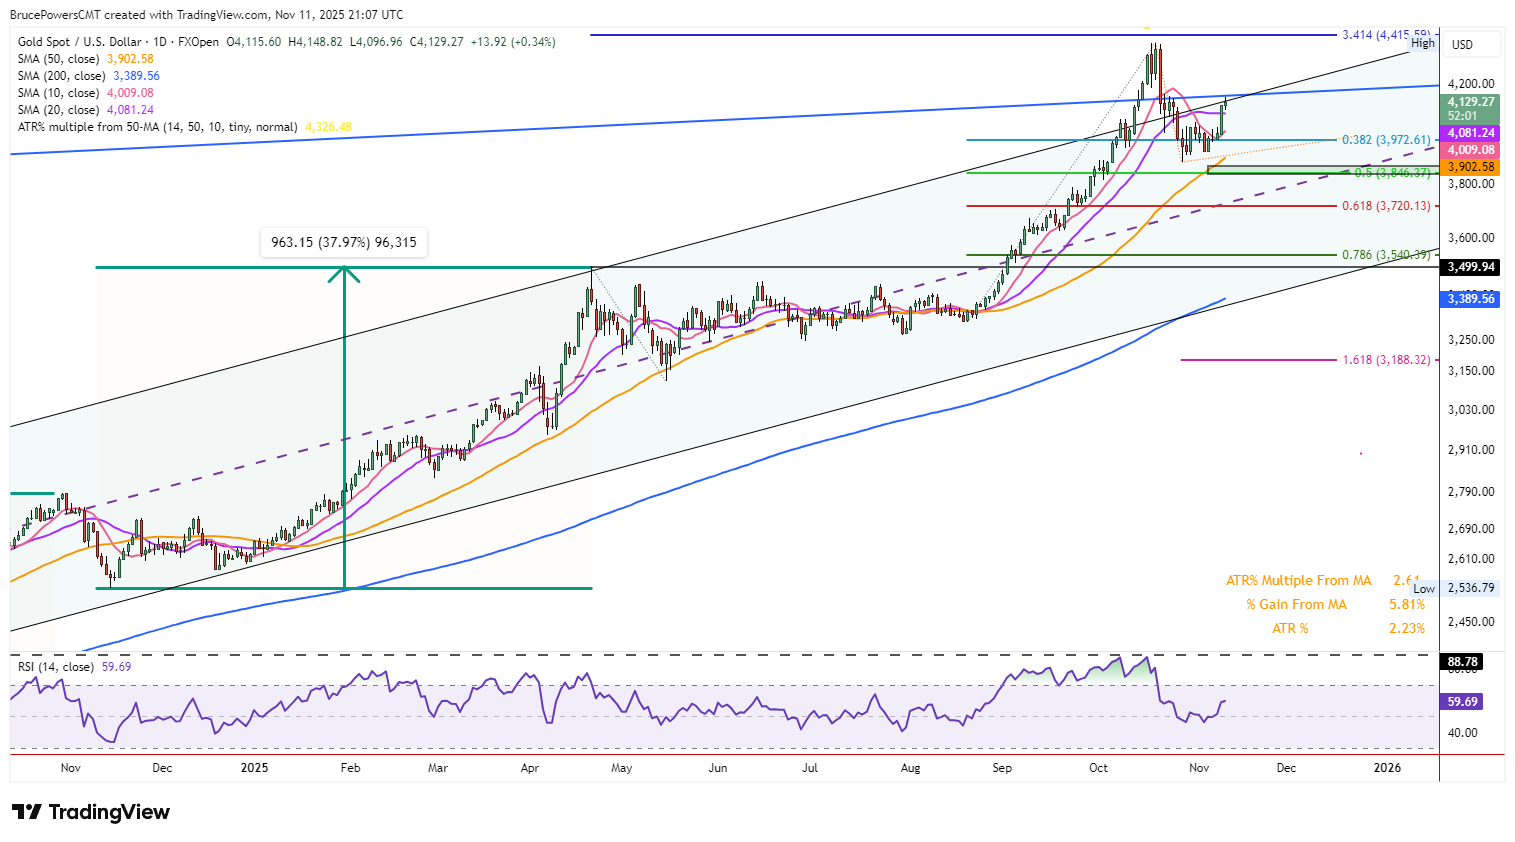
Gold pushed to a 13-day high of $4,149 on Tuesday before intraday sellers emerged, leaving a tight range and a low of $4,097 at writing. Price remains on track for a second straight close above the 20-day average at $4,080—significant after that line failed as support on October 27.

20-Day Reclaim Confirmed
Monday’s strong green candle off the 10-day average reclaimed the 20-day line, with yesterday’s close confirming the move. The 10-day itself has now flipped from dynamic resistance (post-October 21 breakdown) to confirmed support, handing short-term control back to buyers unless the price falls and stays below the 20-day.
Immediate Resistance Cluster
Resistance materialized near the prior minor consolidation zone beneath the $4,381 peak and directly at the convergence of two ascending channel top lines (short-term black, longer-term blue). A continuation breakout triggers above the October 22 high and three-day tight range top; sustained trade above $4,161 would confirm a clean break of both channel lines.
Bounce Structure
The rally from the $3,886 swing low has unfolded with support well above the rising 50-day average at $3,902 and short of the 50% retracement—bullish evidence that the pullback may have already run its course. Rising key support continues to strengthen the underlying trend.
Monthly Chart Concern
October closed with a potential shooting star on the monthly chart. The bearish pattern only confirms, however, on a drop below October’s $3,819 low. Until then, an inside November month remains in play and worth monitoring.
Gold Price Forecast
Every new Gold analysis as it publishes, today's technical signal and key levels, live price — on one page.
See all Gold forecastsOutlook
Buyers hold the near-term edge with the 20-day reclaimed and 10-day supporting. A decisive push above $4,161 validates continuation toward higher channel objectives. Failure to hold the 20-day reopens the risk of a second leg down toward the 50-day and $3,902 area. Watch the monthly low at $3,819—violation there would confirm the October shooting star and shift the intermediate bias bearish.
For a look at all of today’s economic events, check out our economic calendar.