


Sellers Maintain Control as Key Support Nears
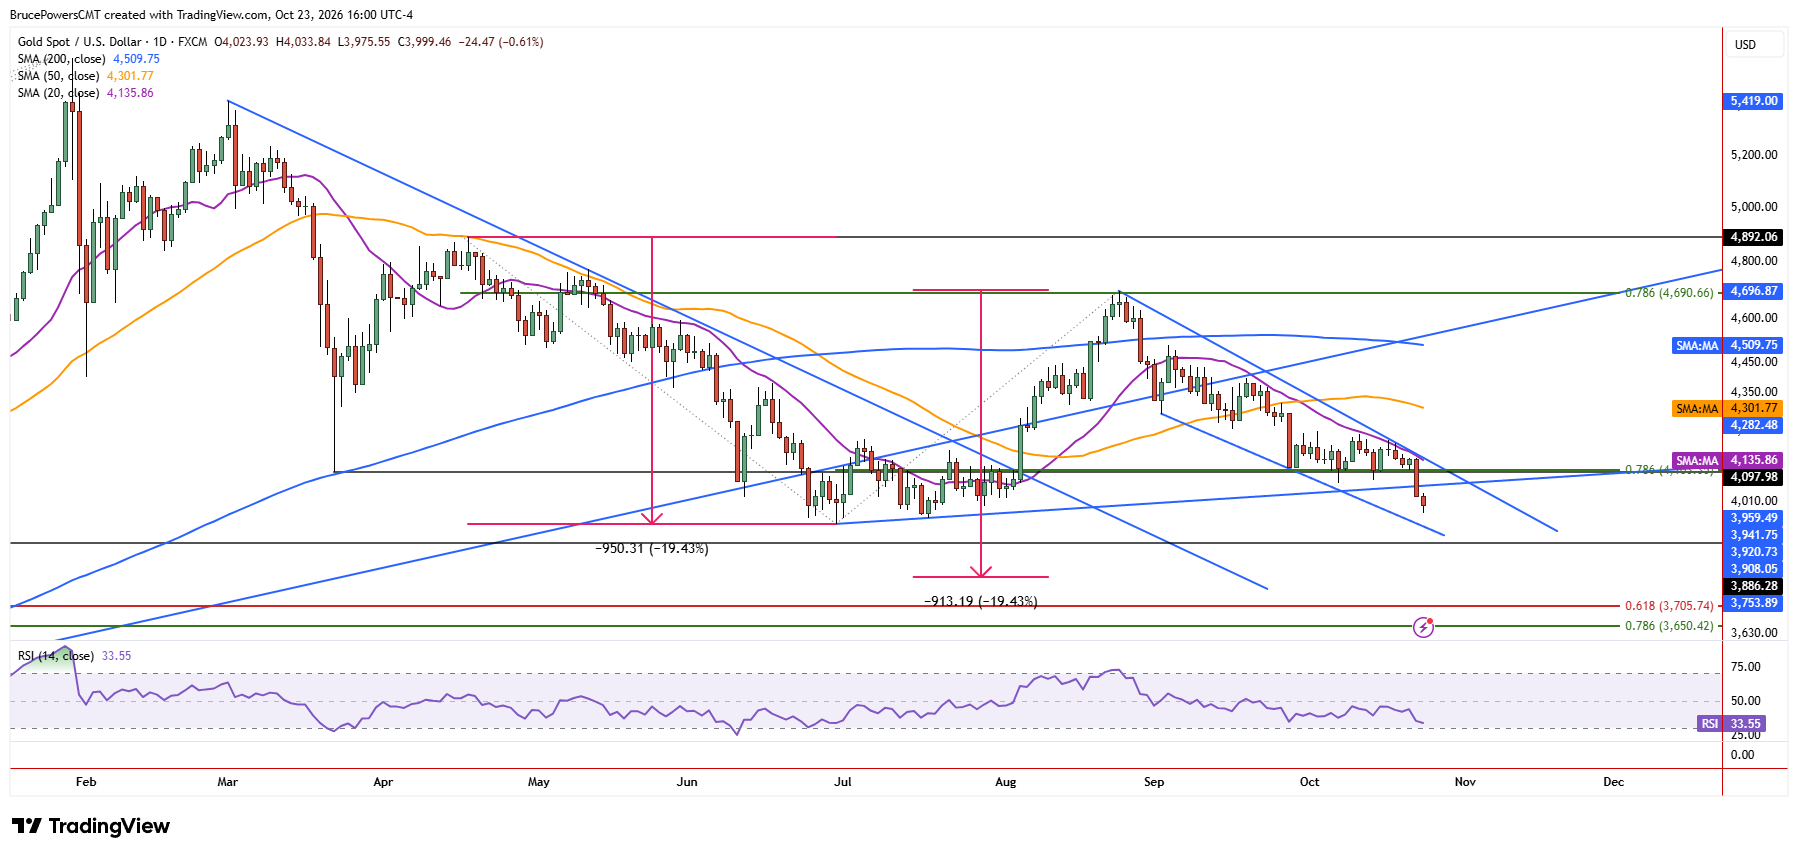
Sellers remain in control of gold on Friday, as it declined to a new low of $3,976 and remained on track to close in the lower half of the day’s range. A lower daily high of $4,034 reflected limited buyer interest following Thursday’s sharp selloff as evidenced by the wide-range bearish candle, reinforcing the sellers’ control. Gold is also on track to record its lowest weekly close since reaching the January peak at $5,597, reinforcing the bearish outlook. That would confirm the trend continuation signal that triggered earlier in the week and suggest that support near the low of $3,942 is at risk of breaking.
Rebound Faces Overhead Resistance
Nevertheless, this week’s low of $3,976 is key near-term support. If a bounce follows then potential resistance levels include the prior low of $4,066 and the 78.6% Fibonacci retracement of the prior advance at $4,103, which was broken as support on Thursday. Thursday’s high of $4,141 and the 20-day moving average near $4,136 are additional resistance levels to watch.
Breakdown Opens Deeper Support Zones
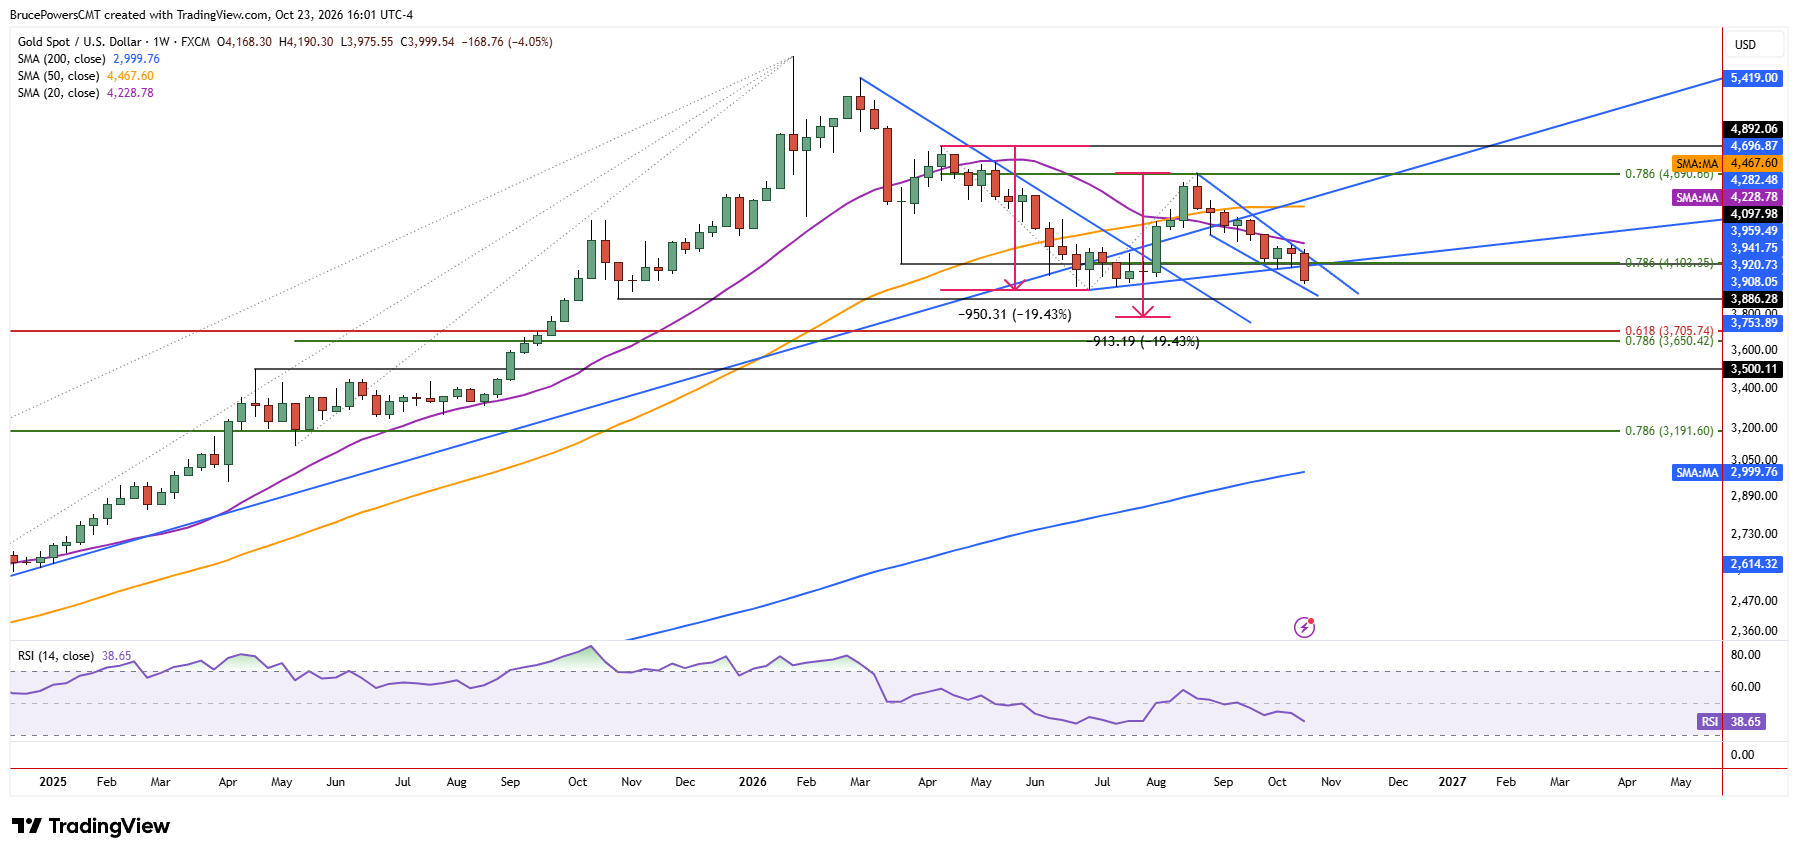
Despite the pickup in bearish momentum this week and the confirmation signals, it remains to be seen whether selling pressure will be sufficient to break below that key support level of the June low breaks. Nonetheless, that is the outlook. The trend is clearly bearish, with multiple confirming signals strengthening the downside case.
If the June low of $3,942 breaks, it will trigger a bearish continuation signal for the trend and open the door to an eventual test of support at the prior trend high of $3,500 from April 2025. However, a prior support zone extends down to $3,886, a higher swing low from October 2025 and could still add to the support zone. Initially, measured-move target near $3,789 would be the first focus for possible support. That level is followed by a Fibonacci retracement zone from $3,706 and $3,650. Until support at $3,942 is decisively broken, however, the next move remains conditional, even as sellers maintain control and downside risk increases.
If you’d like to know more about how to trade gold and silver, please visit our educational area.