


Long-Term Support Gives Way
With the Federal Reserve’s policy decision due Wednesday, gold is consolidating as traders await the next potential catalyst. Gold continued to consolidate on Tuesday below key resistance near prior lows. So far, bearish momentum following recent bearish continuation signals has been muted with little downside follow-through.
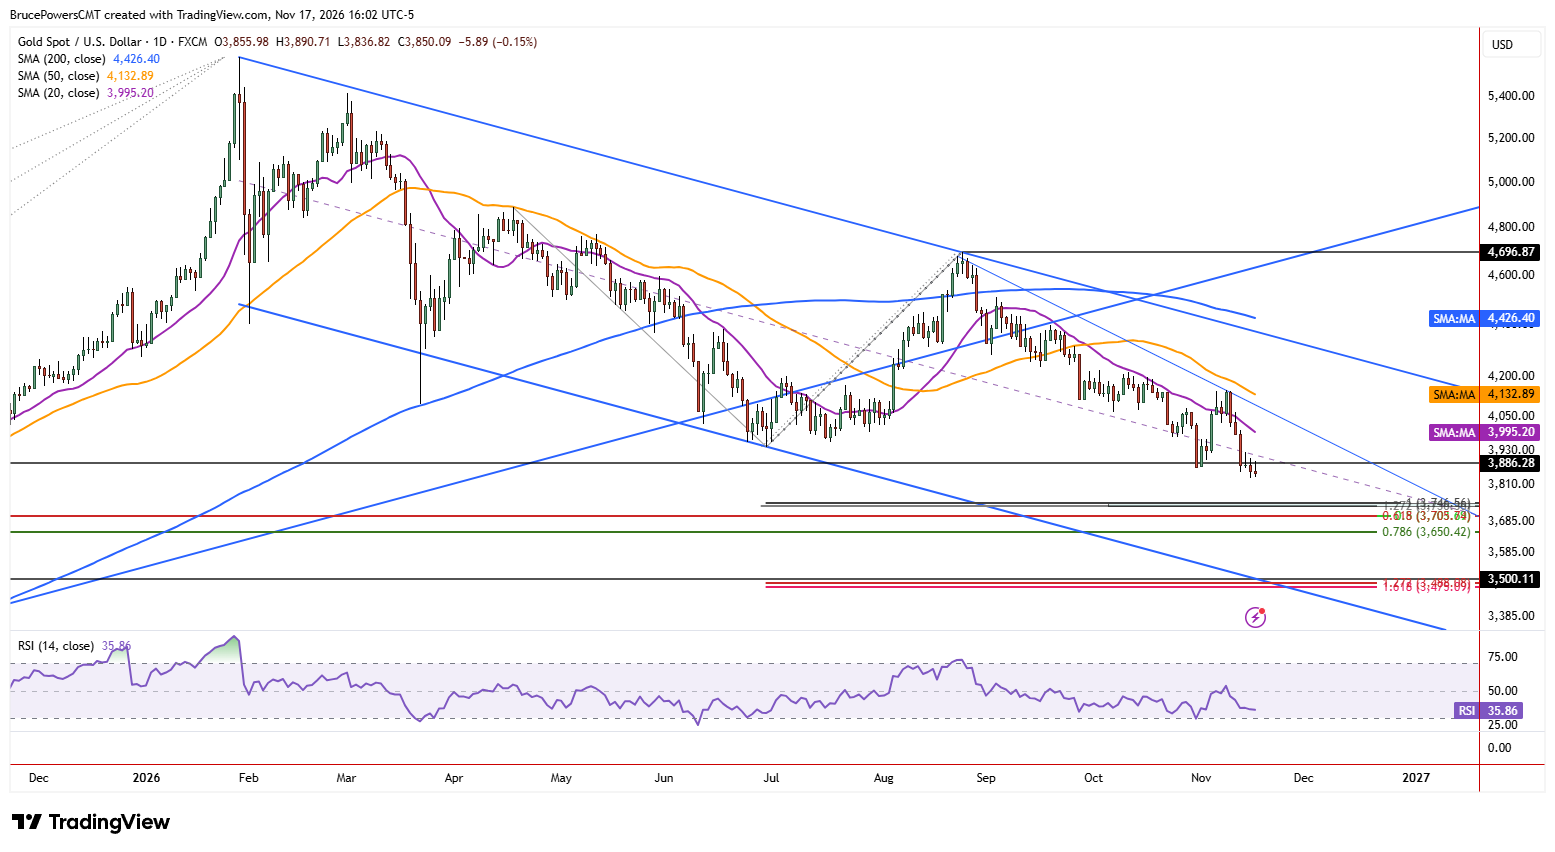
Instead, gold has been consolidating near the lows with three consecutive narrow range days, including Tuesday, while continuing to encounter resistance near the prior low of $3,870 and a higher swing low of $3,886 from October 2025. That key support level from 2025 was first broken in late October this year and the breakdown was confirmed with a weekly close below it, which was bearish. Last week’s close also remained below that long-term support level, further confirming a bearish trend reversal signal.
Bearish Outlook Faces a Short-Term Test
Technically, gold is signaling that it likely has further to decline from here. But the lack of selling pressure following a key bearish signal leaves open the possibility that support holds in the short term at Monday’s new low of $3,832, resulting in a bounce to test resistance before the next bearish continuation signal is triggered.
This scenario would become more likely on a rally above the three-day high of $3,923, with strength initially indicated on an advance above Monday’s high of $3,901. Initial upside resistance targets would be the falling 20-day moving average near $3,996 and Thursday’s high of $4,001. A more significant upside target is defined by the recent lower swing high near $4,148.
Downside Targets Extend Toward $3,650
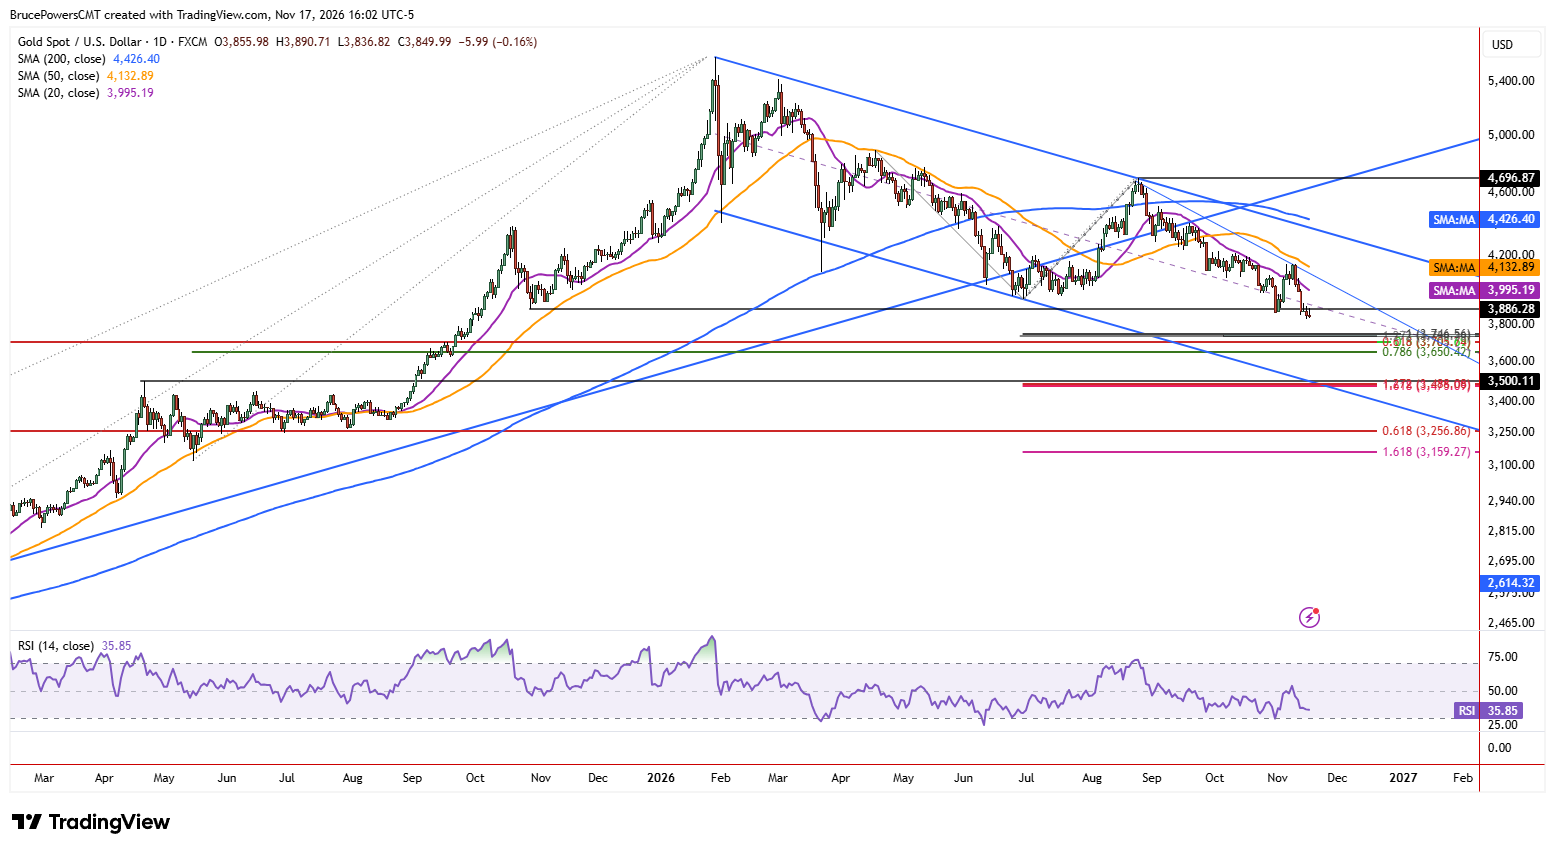
Alternatively, a decisive decline below $3,832 would provide another bearish continuation signal and would likely be followed by a pickup in momentum. An initial downside support zone is indicated from $3,747 to $3,736, defined by two Fibonacci levels but not confirmed by structure. Below that initial range is another Fibonacci confluence zone that includes the 61.8% Fibonacci retracement of a prior advance and the 50% retracement level measured from the larger October 2023 low at $3,706.
That level is quickly followed by the 78.6% Fibonacci retracement for a shorter upswing at $3,650. Notably, a small consolidation range between approximately $3,628 and $3,707 marks a potential support zone, adding to the Fibonacci confluence. These lower targets reinforce the bearish outlook should gold break Monday’s low and selling pressure begin to accelerate.
Gold Price Forecast
Every new Gold analysis as it publishes, today's technical signal and key levels, live price — on one page.
See all Gold forecastsIf you’d like to know more about how to trade gold and silver, please visit our educational area.