


Gold Reversal Puts Recent Support Back in Focus
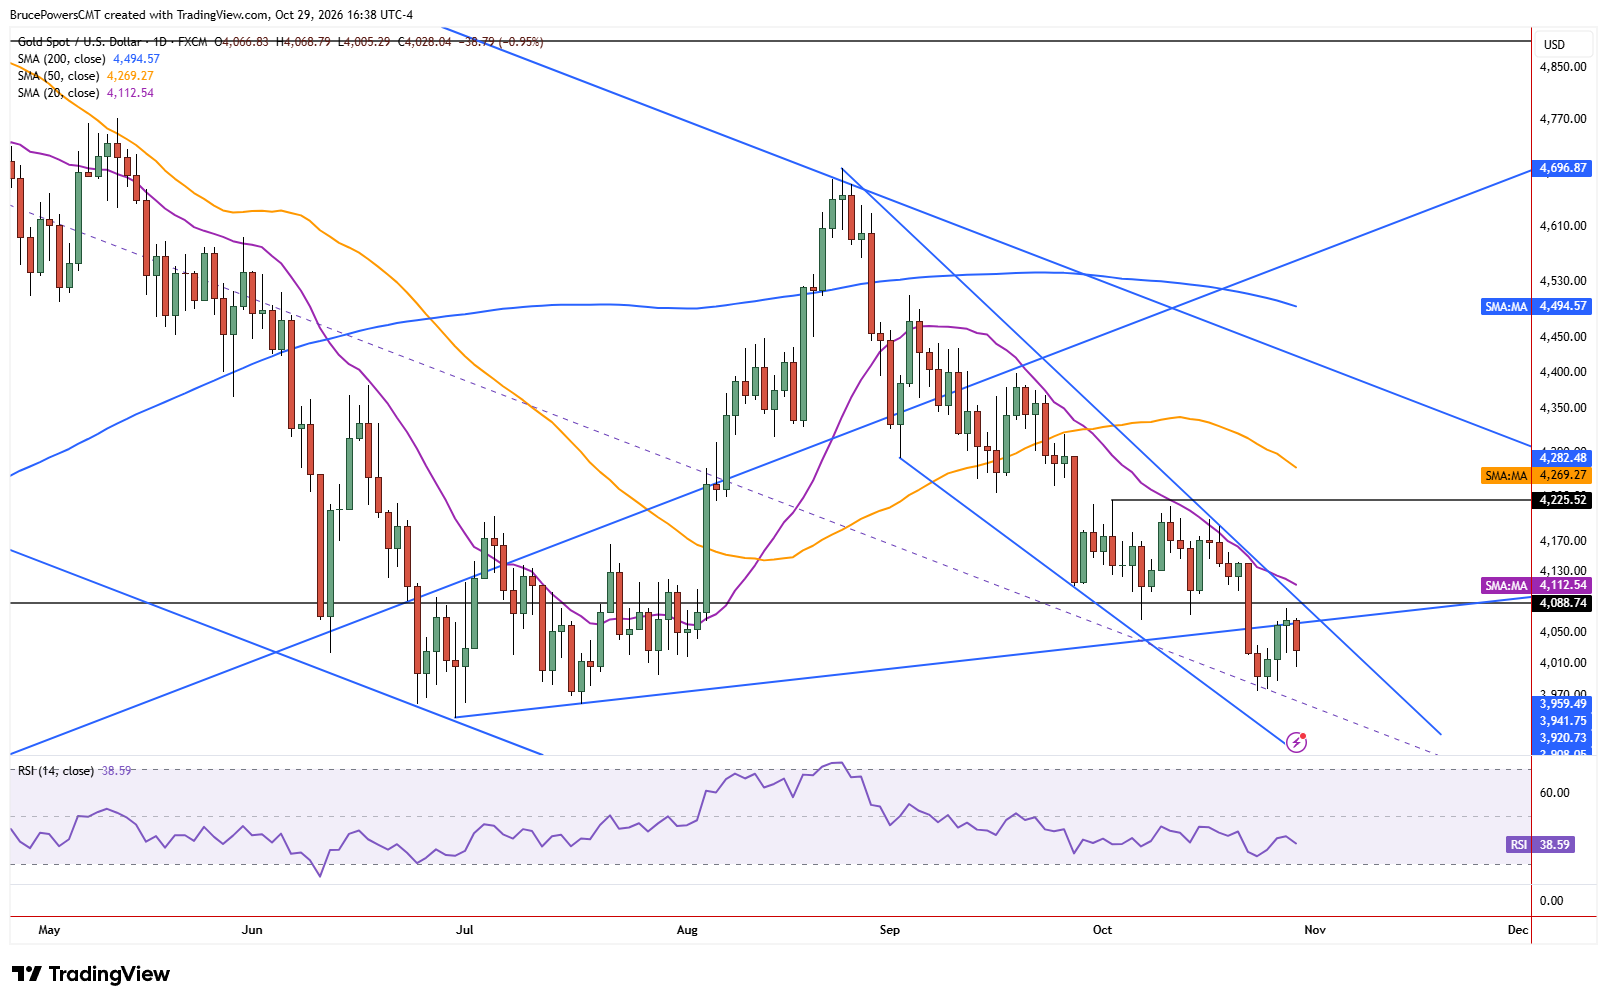
Gold signaled a one-day bearish reversal on Thursday, reaching a two-day low of $5,005, at the time of writing. A lower daily high of $4,069, now daily resistance, may have completed a successful test of resistance near a rising trendline that was previously representing support. Thursday’s reversal was decisive and on track to close near the lows of the day, as sellers continue to control prices. Wednesday’s high of $4,082 is now a lower swing high, further indicating selling pressure.
Bearish Continuation Threatens June Lows
With the downtrend structure retained on all timeframes, including daily, weekly, and monthly, gold faces the prospect of new trend lows, with a possible decline below the June swing low of $3,942. A decisive decline below the recent low of $3,975 would signal a continuation of the bearish trend and put that low at risk of breaking. That would open the possibility of a test of support near the higher swing low of $3,886 from October 2025. If that level failed to hold as support, lower levels may be tested, including a measured move target near $3.786 and a Fibonacci retracement range from $3,706 to $4,350.
Monthly Support Faces a Critical Test
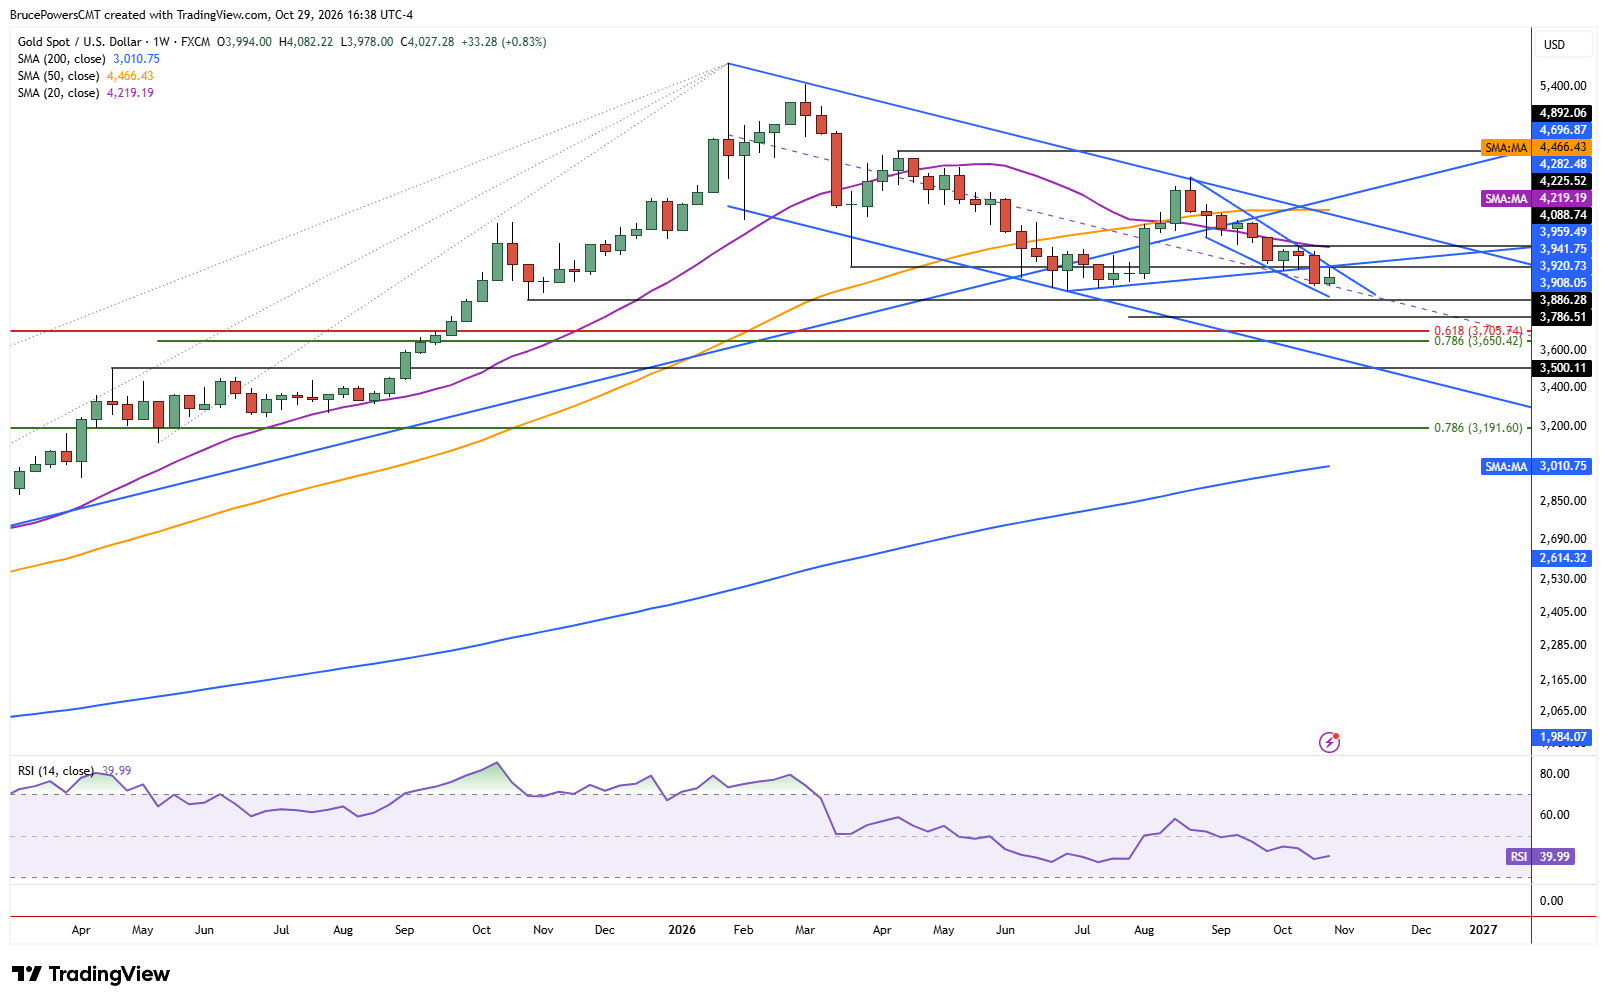
Alternatively, the current support range from around $3,975 to $3,942 may continue to hold and eventually attract buyers and increasing demand. The monthly chart shows dynamic support near the 20-month moving average being tested during October and this is the first time it has been touched since October 2023. Also, unless there is a sharp advance on Friday, October is on track to close in the lower quarter of the month’s range, which shows weakness. This adds to the significance of support at the $3,795 low, especially since this month will end after only one more session.
Monthly Breakdown Could Confirm Deeper Weakness
At the same time, a drop below October’s low after Friday will provide a bearish monthly signal and a decline below the 20-month moving average. The recent establishment of a lower swing high and successful test of resistance near the 200-day average, after it had previously represented dynamic support until early-June, supports this scenario.
If you’d like to know more about how to trade gold and silver, please visit our educational area.