Short-Term Bounce Tests Broken Support
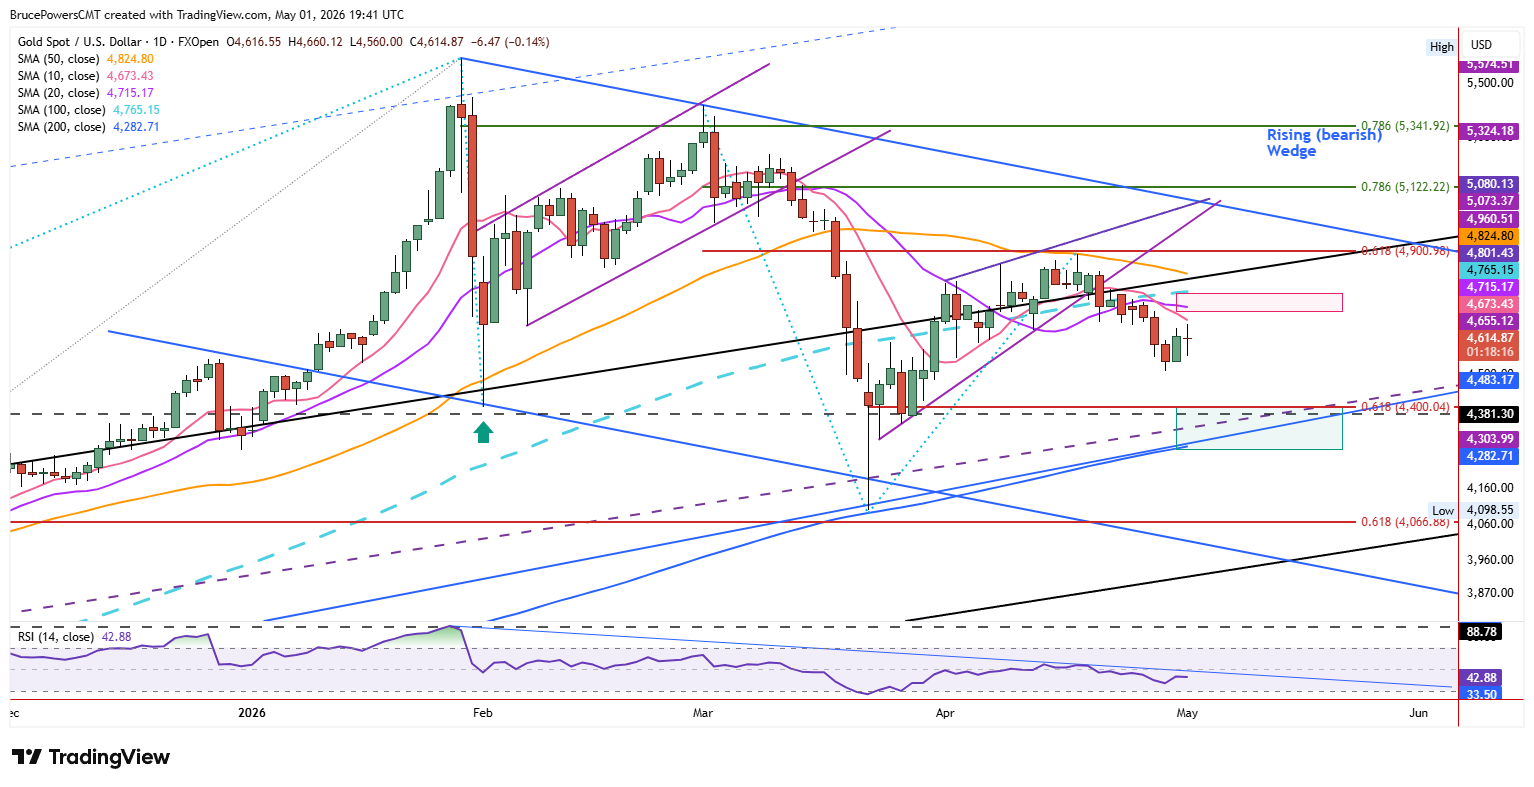
Gold continued to bounce to a three-day high of $4,660 on Friday, establishing a minor higher high and higher low. Support for the bearish retracement was seen at $4,510 on Wednesday, leading to a two-day bounce and test of prior support at the interim swing low of $4,640, which is now showing resistance. That price zone represents immediate resistance along with the falling 10-day moving average, now at $4,674.

Muted Momentum into Key Moving Averages
Bullish momentum has been muted during the bounce, suggesting continued downward pressure. Nonetheless, the bounce could extend towards potential resistance near the 20-day moving average at $4,716 or the 100-day moving average, now near $4,765, while gold remains bearish overall. There has been only one leg down in gold following the breakdown of a rising bearish wedge formation last week. That followed resistance near the 50-day moving average and the establishment of a lower swing high of $4,890. Once prior key trend support of the 50-day average was successfully tested as resistance, the sellers took back control.
Wedge Breakdown Triggers Broader Weakness
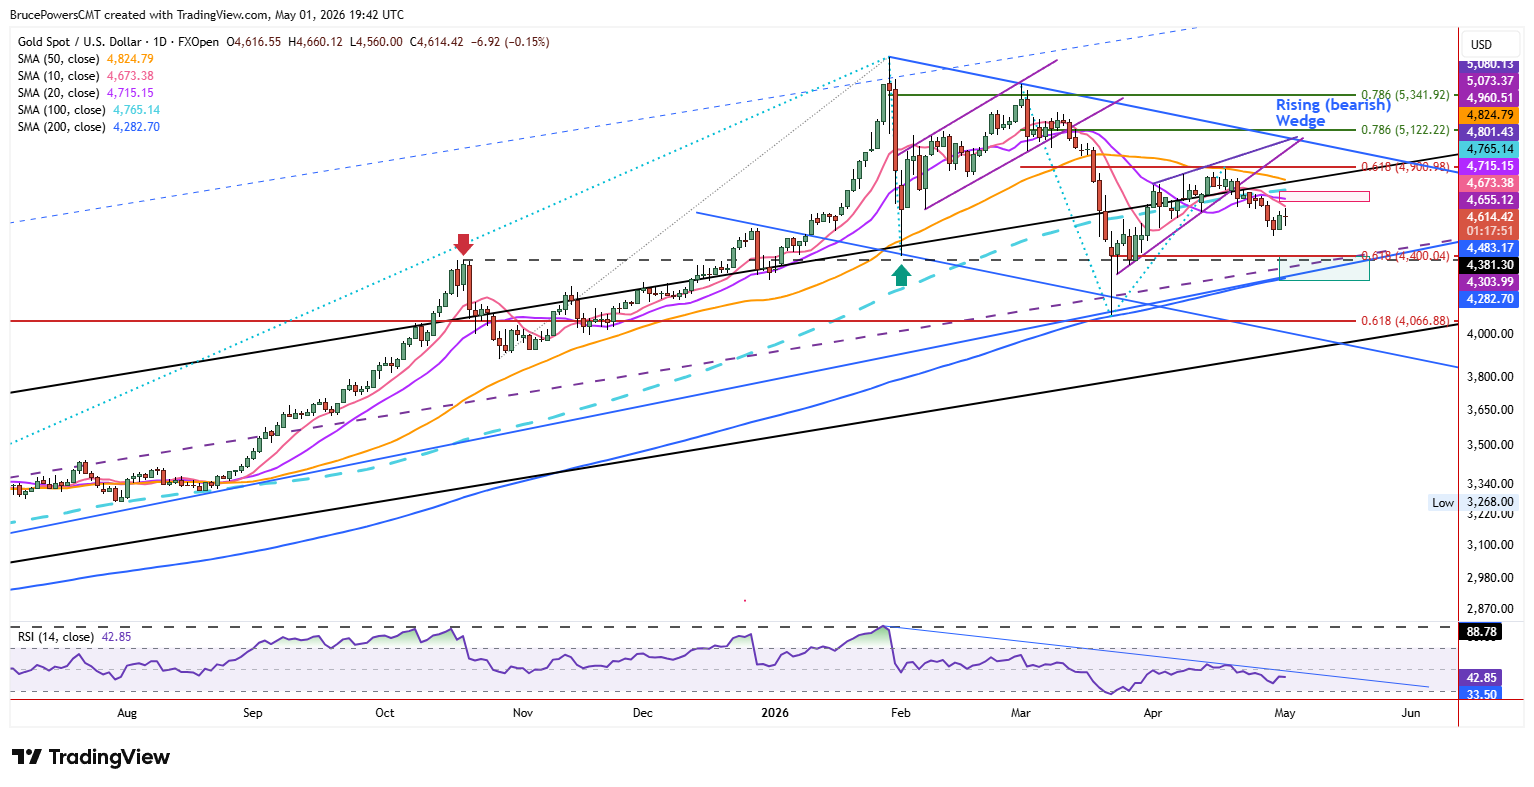
The breakdown from the wedge formation that triggered a week ago Tuesday also broke below several key trend indicators that gold had been recently attempting to reclaim, including the 10-day, 20-day, and 100-day moving averages and the top boundary of a long-term rising trend channel. Given the confluence of resistance near the top of the channel and subsequent weakening, further downside suggests a lower target near the midline of the channel. A little lower than that is the 200-day moving average at $4,283. It represents the lower end of the potential support range along with an internal uptrend line. Recently, the two trend indicators have been aligned, indicating a more significant dynamic support zone.
Long-Term Support Framework Remains Intact
The sharp decline in March bounced off support near the 200-day moving average, establishing a new higher swing low at $4,099. That was the first time it was touched since November 2023, and the sharp bullish response confirmed it as a key long-term trend indicator. The top of the potential support zone begins near the February spike low of $4,402 and goes to the 200-day line.
Bearish Context Remains Dominant Despite Bounce
Overall, while short-term bounces are emerging, price action remains anchored below key broken trend indicators. This keeps the broader focus on whether rallies into resistance continue to attract selling pressure within the ongoing corrective structure.
Gold Price Forecast
Every new Gold analysis as it publishes, today's technical signal and key levels, live price — on one page.
See all Gold forecastsIf you’d like to know more about how to trade gold and silver, please visit our educational area.