


Initial Support Fails as Sellers Regain Control
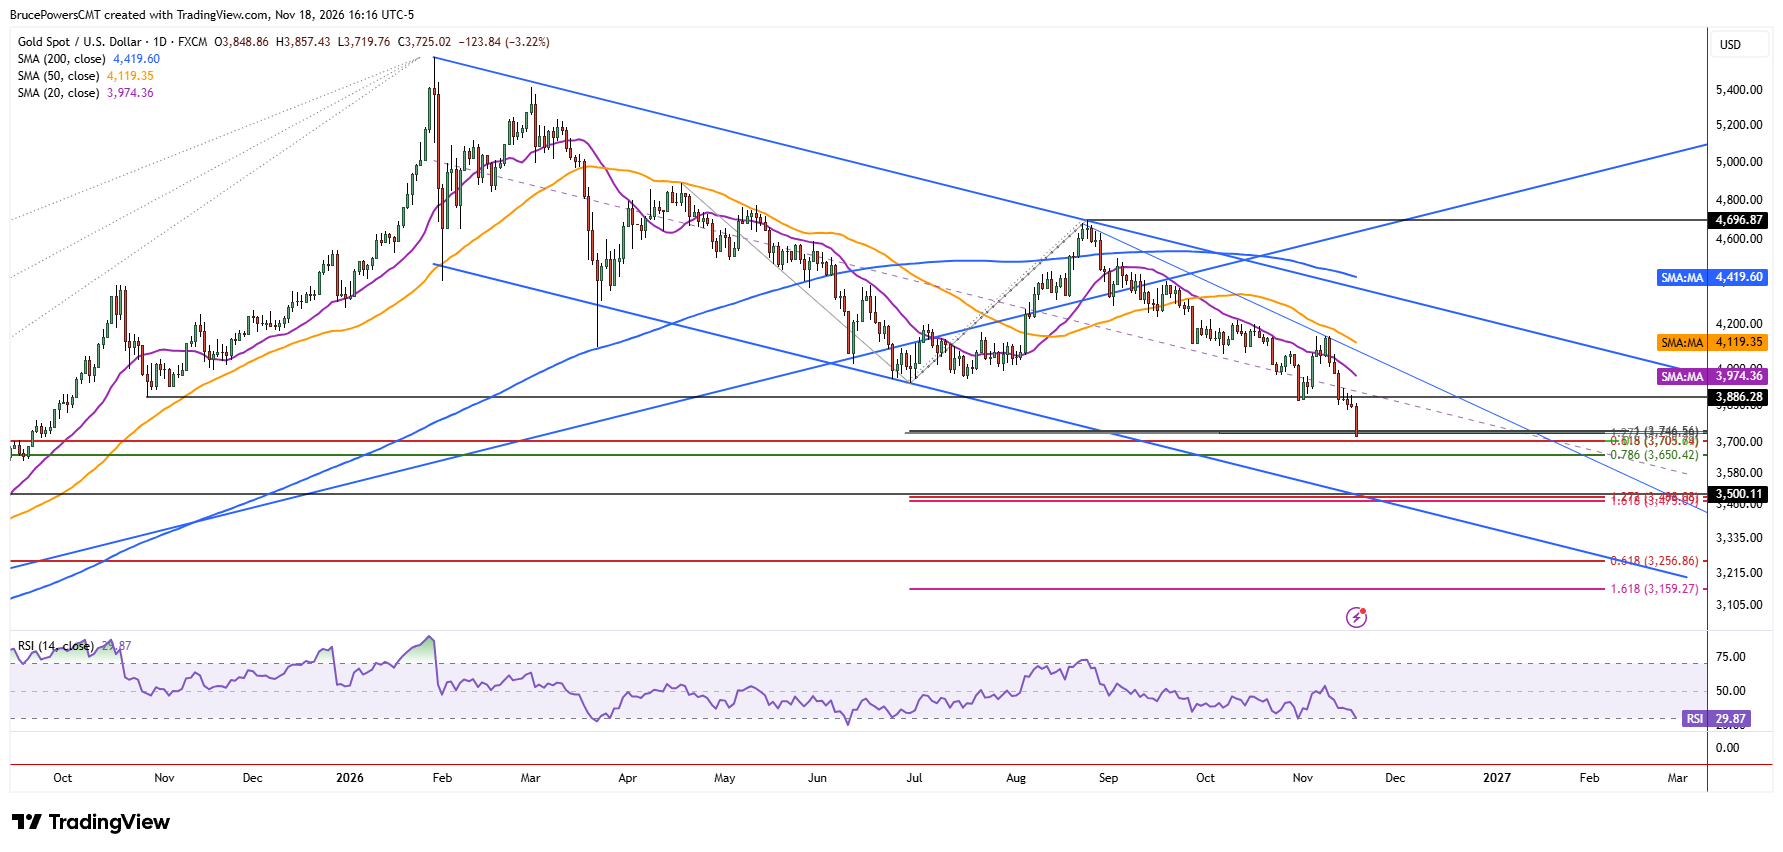
Gold accelerated its decline on Wednesday, with sellers remaining in control throughout the session. A new low of $3,720 was reached, with trading continuing near session lows, at the time of writing. An initial support zone from $3,757 to $3,736 was briefly recognized on the first approach, triggering a minor intraday advance before sellers regained control and pushed gold below the potential support zone. This failure to hold initial support reinforces the growing bearish pressure.
Decisive Breakdown Changes Technical Outlook
The increase in bearish momentum follows a decisive decline below the higher swing low of $3,886 from October 2025. That generated a more decisive bearish reversal signal for the prior rising trend, after earlier bearish signals failed to generate downside follow-through. Now that the decline below that low is decisive, lower support targets are more likely to be tested before gold establishes a sustainable low. The falling channel suggests that the lower boundary could eventually be tested as support, and that possibility is now looking more likely.
Major Support Confluence Near $3,500
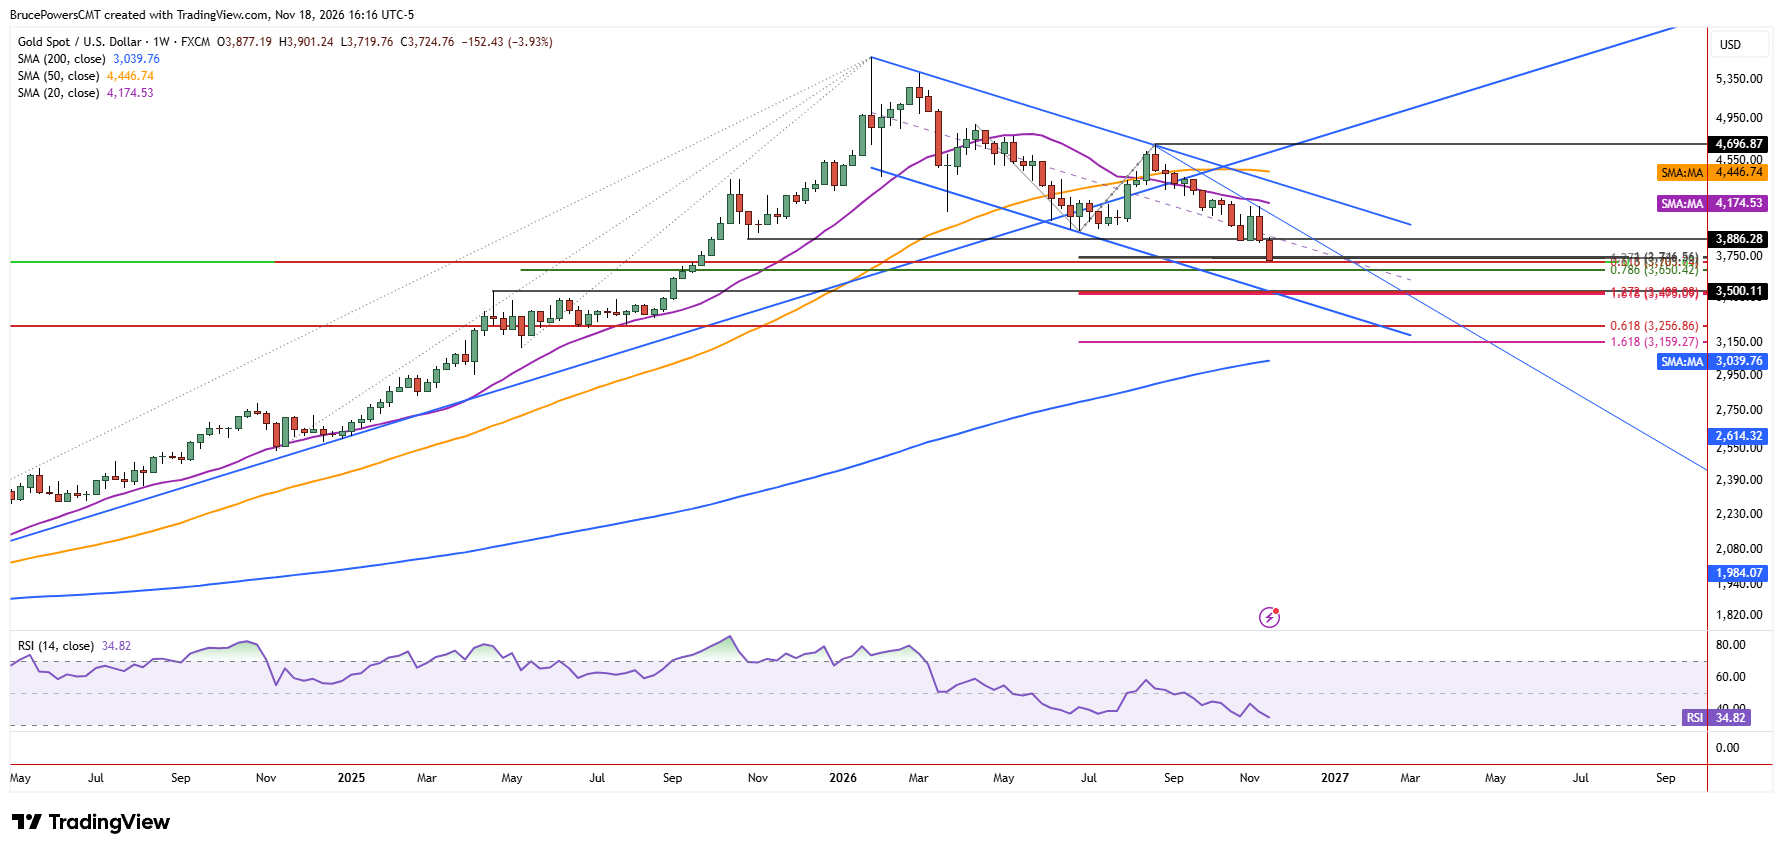
Notably, there is a support confluence zone from around $3,500 to $3,475, with a possible extension below that range. It is now essentially straight down from where gold is now trading. Since the lower channel boundary will soon be below that price range, the chance that it is eventually reached increases. Also, the top of the support zone is the peak from April 2025, which marked the top of a 19-week consolidation base. This suggests that support could also emerge lower in the consolidation formation.
Interim Fibonacci Support Versus Deeper Decline
Nonetheless, this doesn’t mean gold will move directly to lower levels. There remain two potential support levels before the 2025 peak is reached. These include a 61.8% Fibonacci retracement at $3,705 and a 78.6% Fibonacci retracement at $3,650. The breakout from the consolidation base occurred in September 2025, and it was the more significant breakout of a base since then.
Although the potential Fibonacci support levels could lead to a counter-trend rally, those levels coincide with only a small consolidation pattern from September 2025, leaving gold vulnerable to testing the prior peak at $3,500 or lower. Consequently, while interim bounces remain possible, the decisive break below $3,886 keeps the focus on progressively lower support, including the $3,500-$3,475 confluence zone.
Gold Price Forecast
Every new Gold analysis as it publishes, today's technical signal and key levels, live price — on one page.
See all Gold forecastsIf you’d like to know more about how to trade gold and silver, please visit our educational area.