


Bearish Continuation Exposes Gold to Deeper Losses
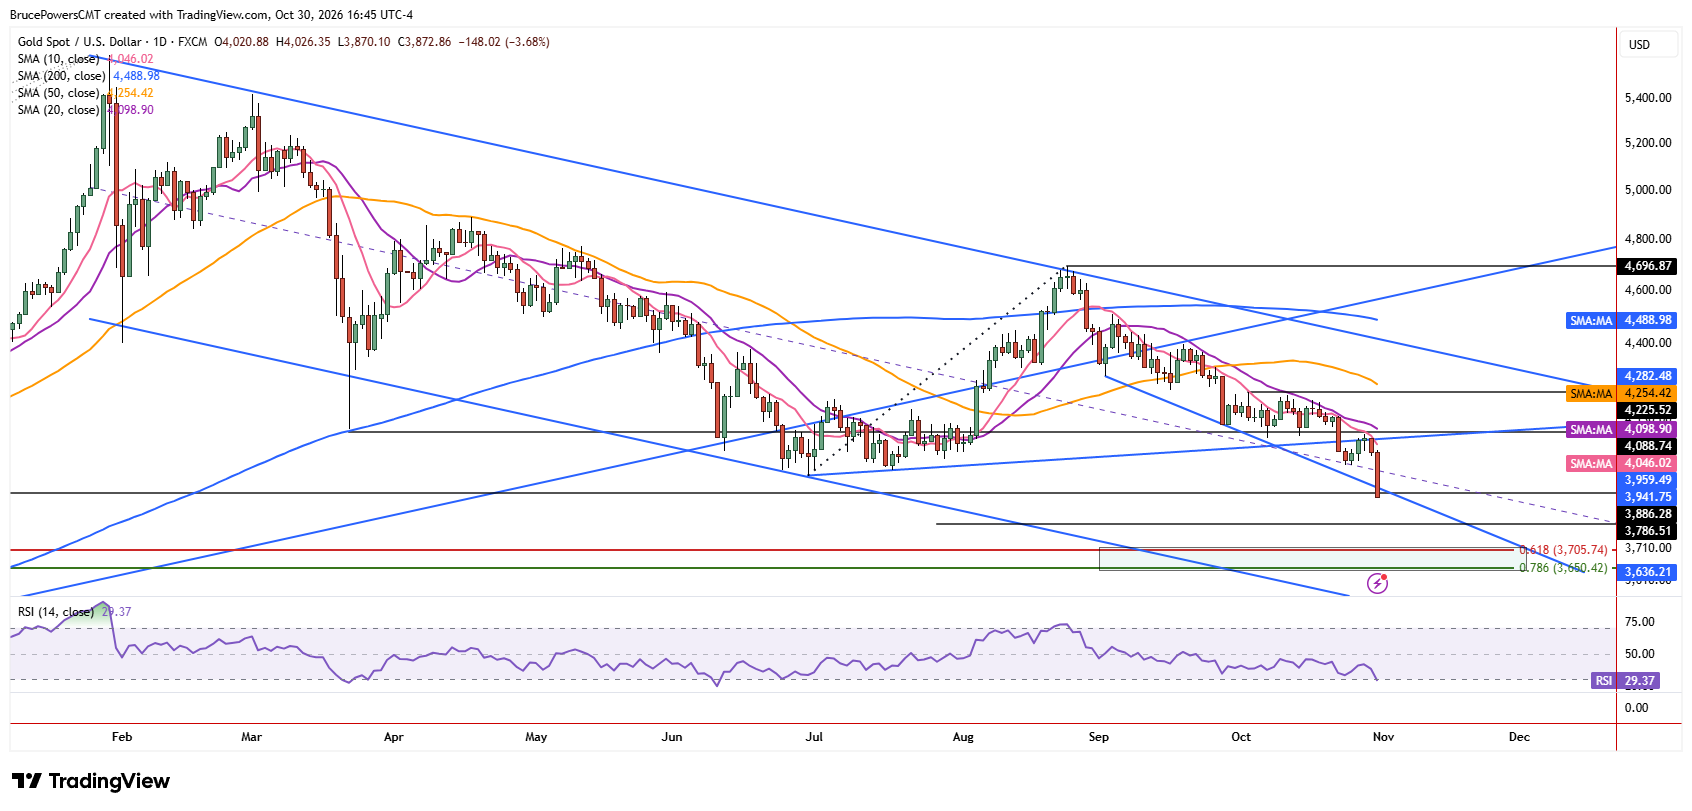
Gold triggered a bearish continuation of its decline on Friday with a decline below the prior low of $3,942. This resulted in a new corrective low of $3,870 and a test of support near the higher swing low of $3,886 from October 2025. Sellers remain in control at the time of writing with a lower level possible before the close. The bearish continuation signal increases the chance for lower potential support levels to be tested. Friday’s selling was decisive, resulting in a full-bodied red candle and suggesting that sellers may remain in control until lower support is reached.
Falling Channel Signals Further Downside Potential
The recent swing high of $4,697 reversed from resistance near a falling trendline that is the upper boundary of a declining channel. This suggested the potential for the lower boundary of the channel to eventually be tested as support. Then on Friday, the midline of the channel was broken to the downside after being recognized as support at the prior low of $3,975. Whether or not the lower boundary is reached, the channel dynamics increase the chance that the next lower support levels may be reached during this extended leg down in gold.
$3,789 Target Opens Door to $3,500
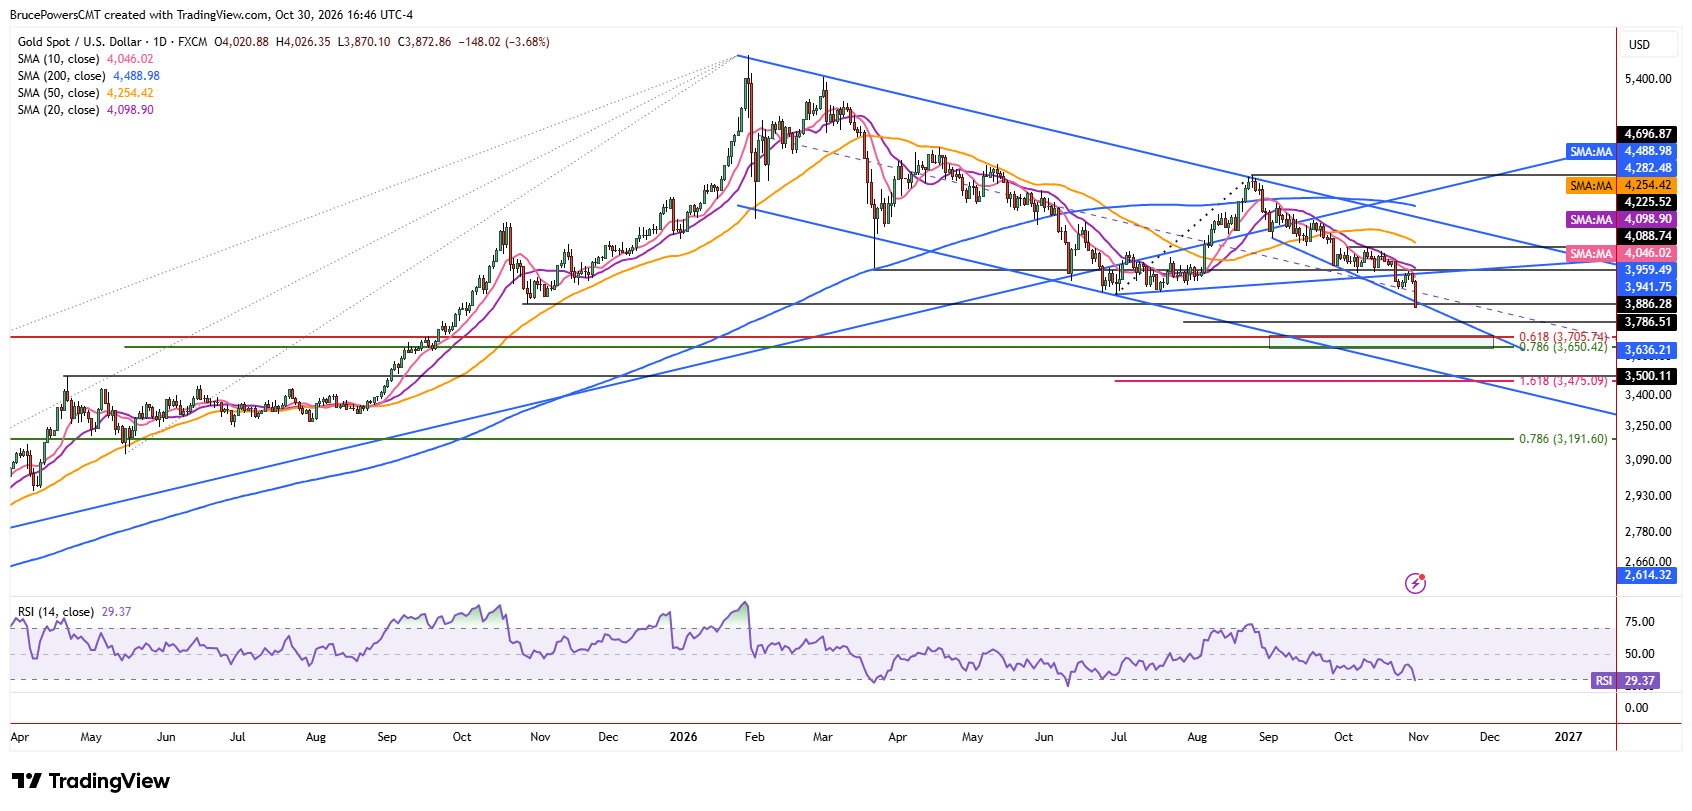
Below the October 2025 swing low of $3,886, a measured move target near $3,789 is the next lower potential support area. That is followed by a Fibonacci retracement support zone between $3,706 to $3,650. However, a full pullback to support could reach the prior high of $3,500 from April 2025. Notably, that lower potential target could be hit while gold remains within the falling channel boundaries. Given the accelerating bearish momentum on Friday, the $3,500 support area increasingly appears vulnerable to a test before the bearish correction from the January peak of $5,597 is complete.
Rebounds Face Multiple Layers of Resistance
Given the new bearish signal, sellers are clearly in control. Short-term strength is likely to be limited before resistance is reached, followed by further selling pressure. Key potential resistance levels for a bounce would be near the prior low of $3,942, the most recent lower swing high at $4,082, and the 20-day moving average near $4,098 and falling.
If you’d like to know more about how to trade gold and silver, please visit our educational area.