


Breakout Confirmation Meets First Support Test
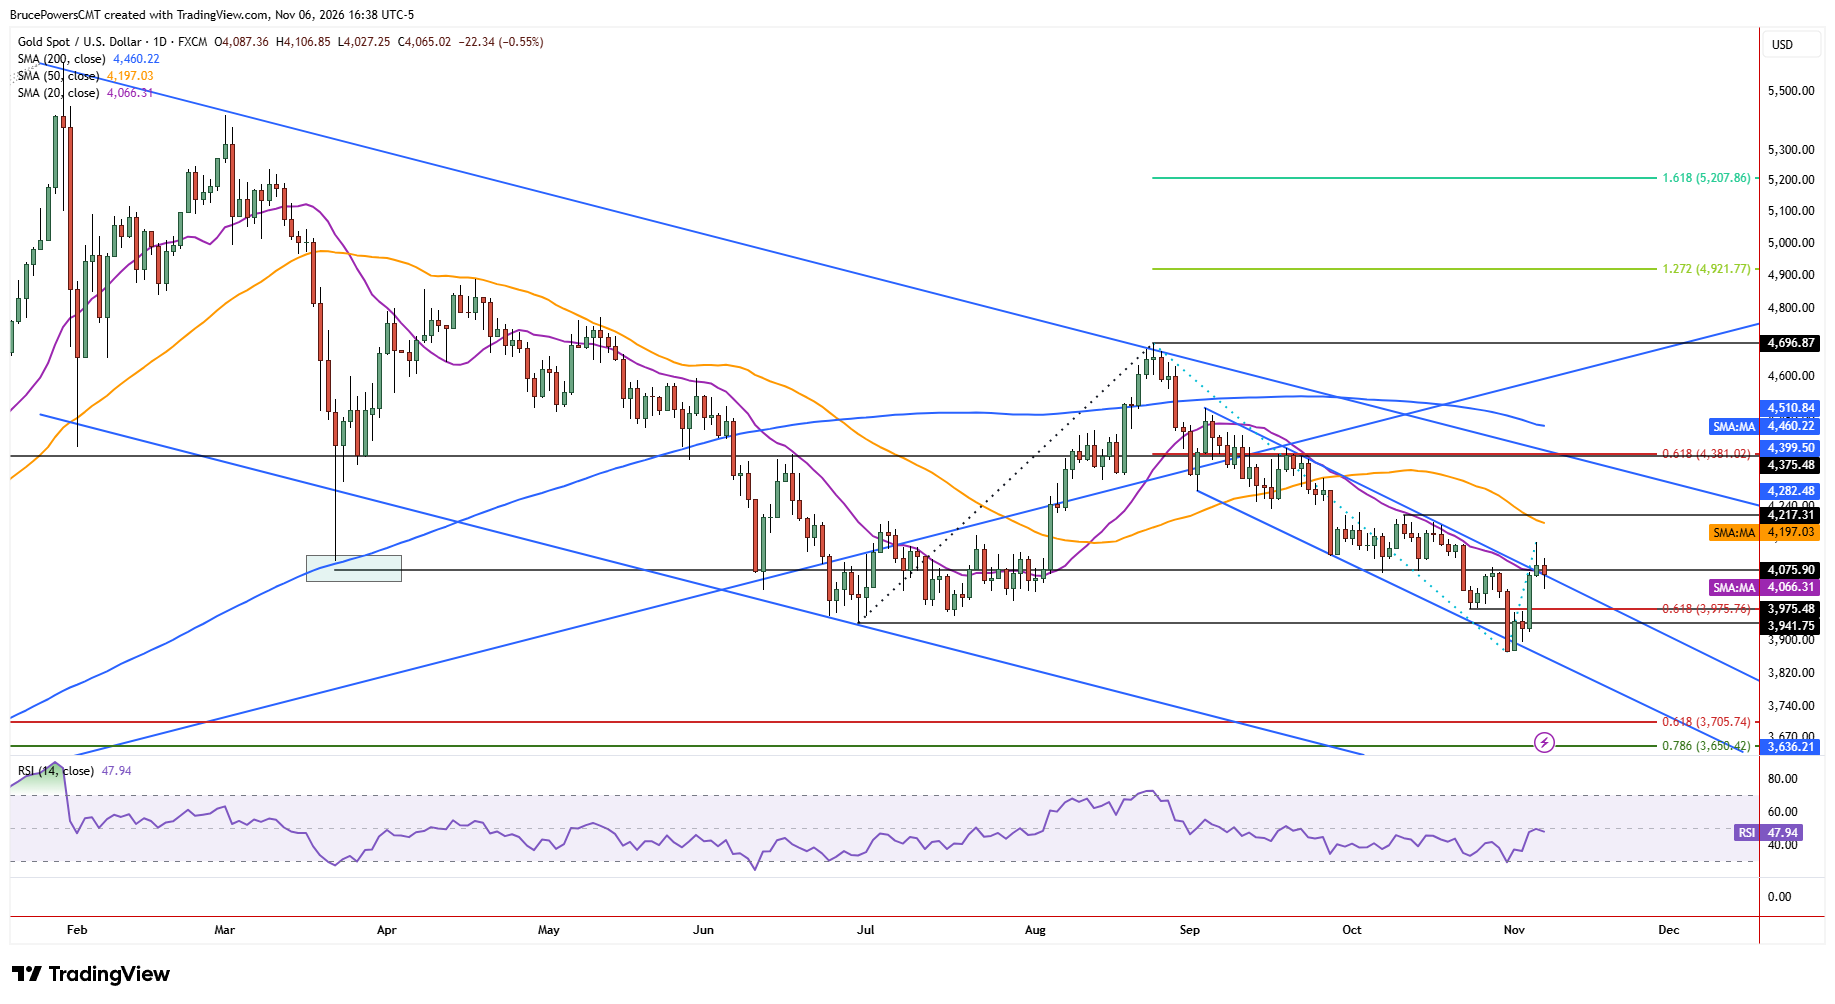
Gold pulled back on Friday to test a trend support zone, establishing a lower daily high of $4,107 and a low of $4,027. This followed bullish signals from Thursday, including a reclaim of the 20-day moving average and downtrend line, plus a breakout above the recent lower swing high of $4,082 on the daily chart, which also represented a bullish reversal signal on the weekly chart.
A higher weekly low was also generated this week at $3,875, supporting the potential for the beginning of a reversal in the current decline. The bullish signal was confirmed with a close above each of the resistance levels. Friday’s pullback now provides an opportunity to assess whether those former resistance levels will hold as support.
Channel Breakout Strengthens Reversal Case
Since the recent decline took the form of a parallel trend channel, a breakout from that pattern also triggered on Thursday. The breakout hit resistance at $4,147 and closed in the lower half of the day’s range, indicating that sellers were beginning to take control and raising the potential for a pullback to test prior resistance as support. That dynamic continued Friday.
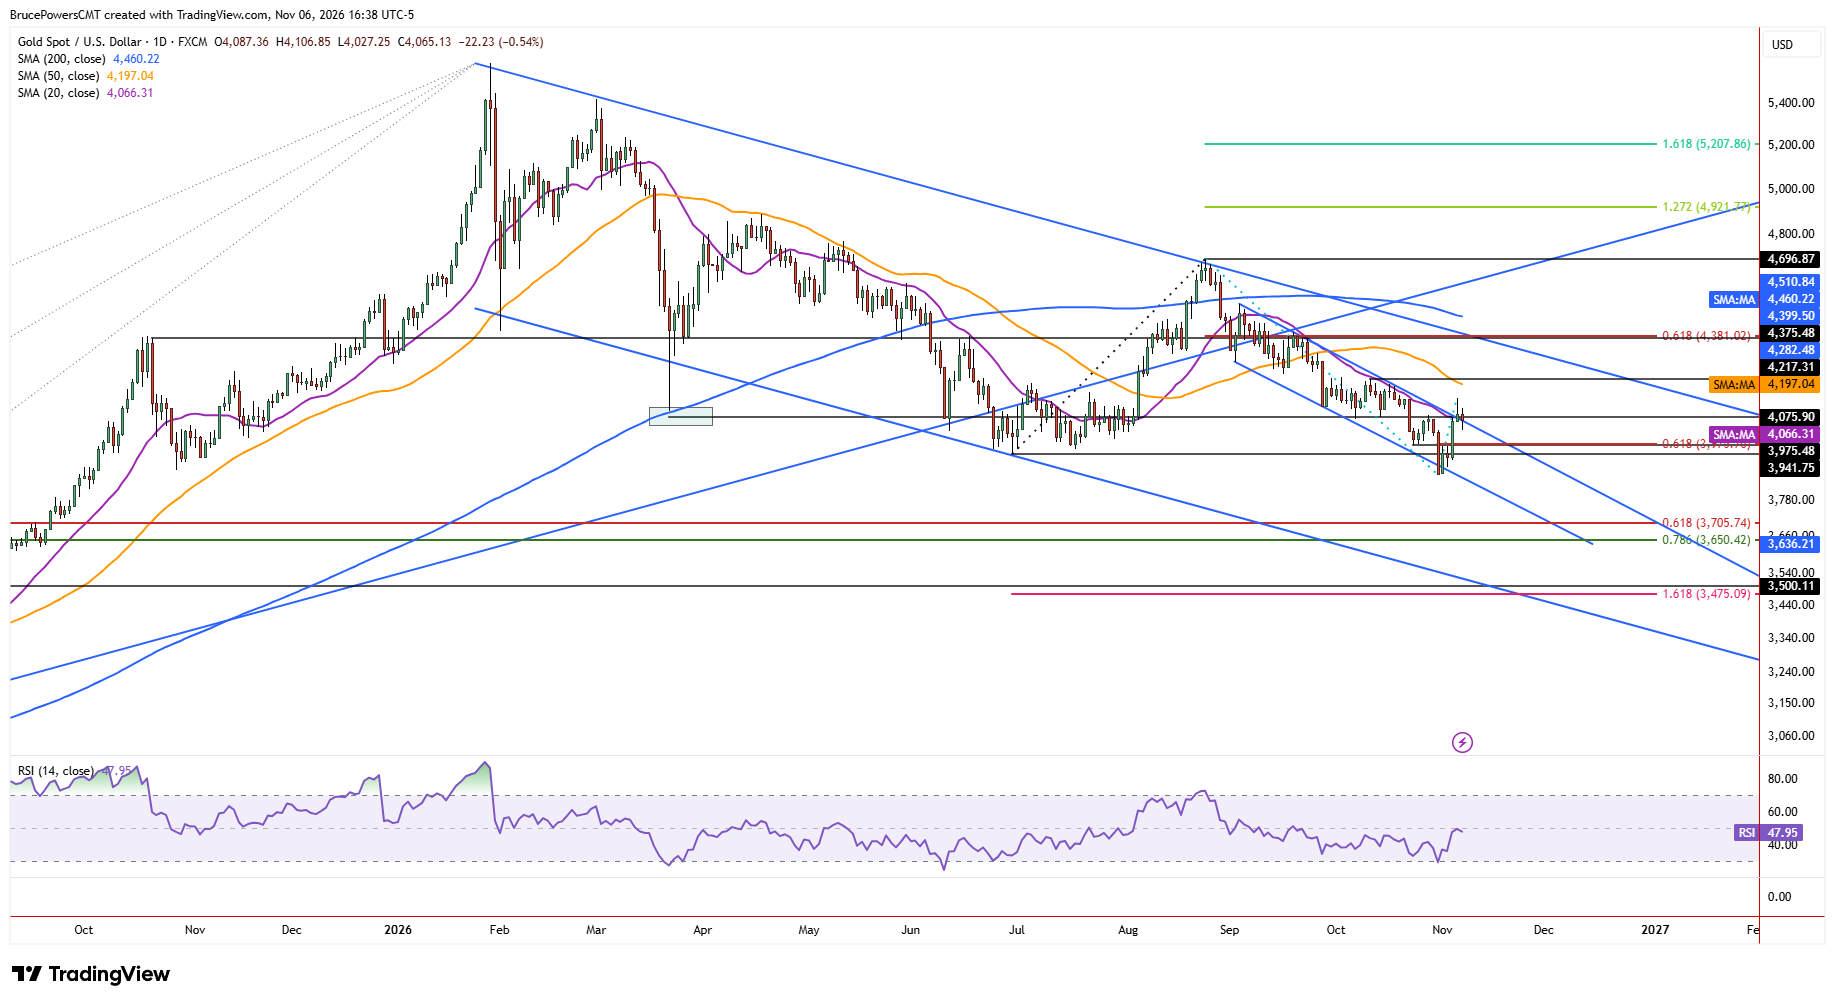
Bullish momentum that led to the breakout began from the recent low of $3,870, with a 7.15% advance completed at Thursday’s high. That exceeded the previous three upswings that occurred since the August swing high at $4,697, the largest of which was an advance of 5.33%. This adds to the bullish technical evidence that buyers may be reclaiming control. It also suggests that by the time the prior swing high was recovered, gold was extended and prone to at least a small correction. This bullish price behavior indicates that the $3,870 low may have completed the corrective decline from the August high.
Fibonacci Support Defines Critical Downside Risk
If gold falls below Friday’s low of $4,027, it could decline further to test support near the 61.8% Fibonacci retracement at $3,975, which is reinforced by a previous swing low. However, since the upside breakout signal from Thursday was confirmed with a close above the range, a recovery and continuation of the bullish reversal process is anticipated. Holding the breakout area as support would strengthen the case that the $3,870 low marked the end of the corrective decline from August.
If you’d like to know more about how to trade gold and silver, please visit our educational area.