


Bullish Reversal Challenges Short-Term Downtrend
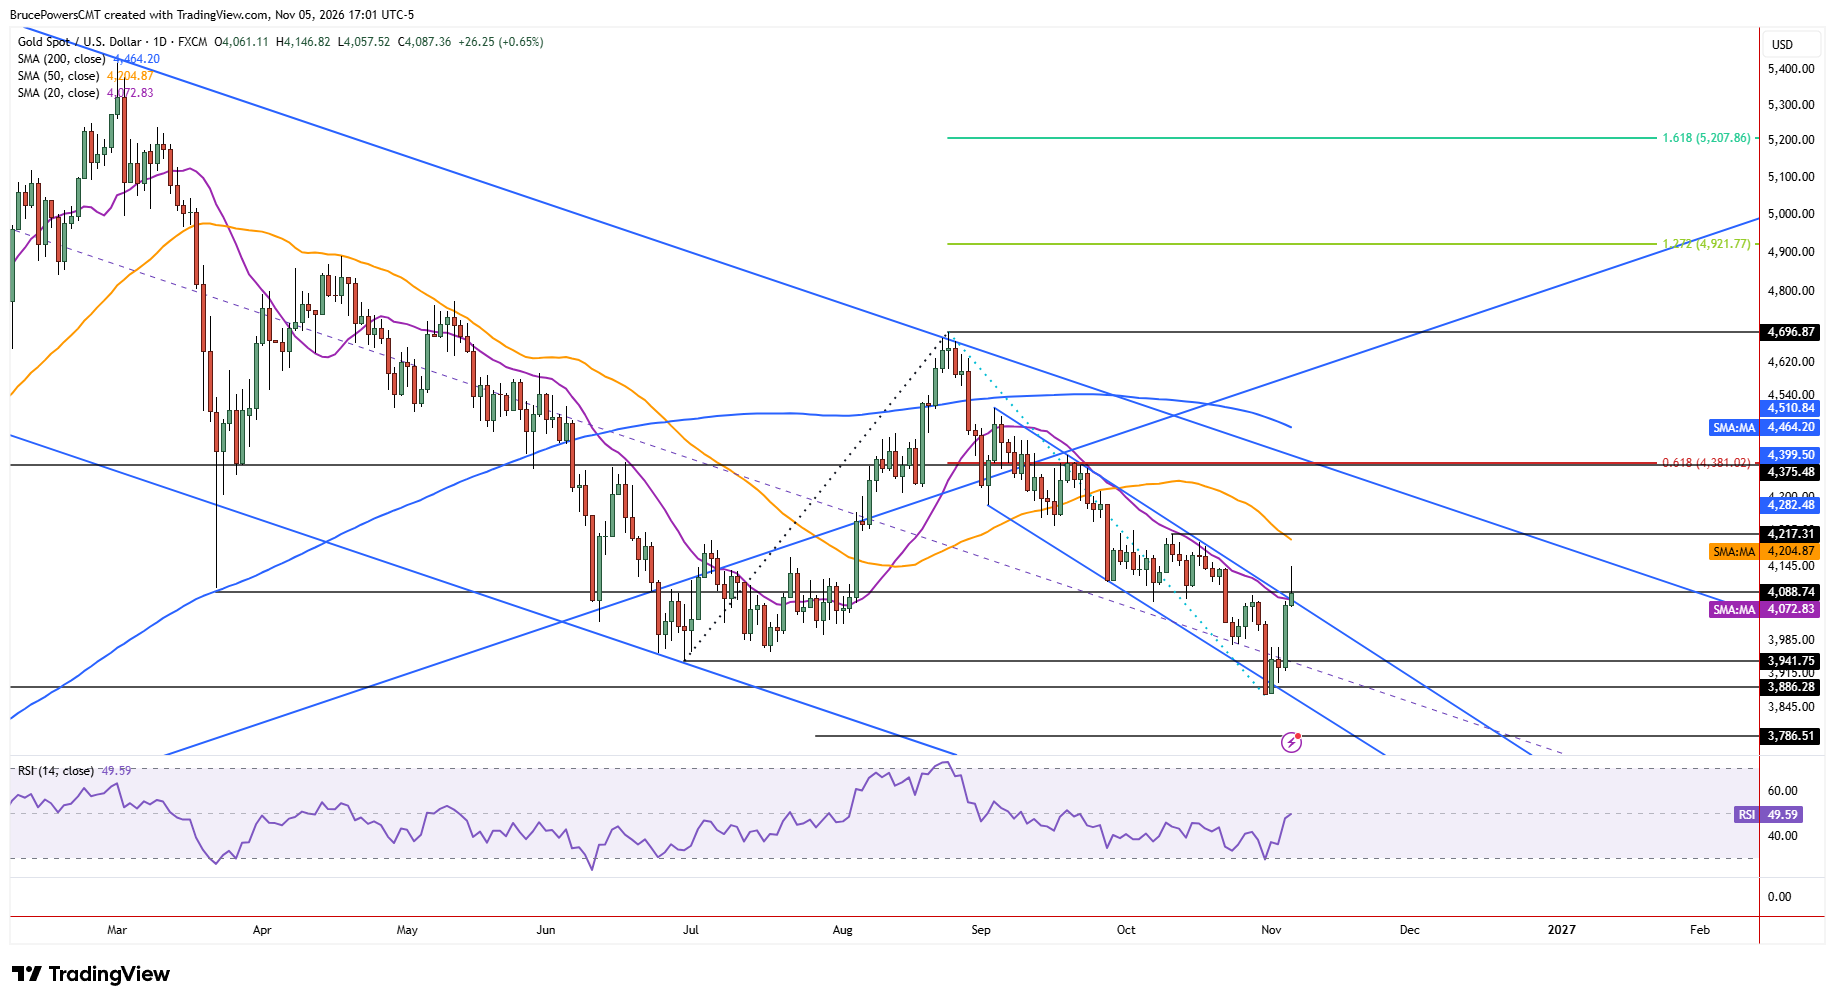
Gold signaled a weekly bullish reversal on Thursday, as it rallied above last week’s high of $4,082, before reaching a high of $4,146. That high was a lower swing high on the daily chart and a key part of the short-term bearish trend structure. The breakout has added significance since a downtrend line and 20-day moving average at $4,073 were recovered during the advance. These bullish signals could result in a bottom for the correction and a new advance. However, this doesn’t mean it starts immediately and further testing of support could occur before bullish confirmation suggests higher prices.
$4,082 Becomes Critical Confirmation Level
Bullish momentum that led to the breakout above $4,082 began from the recent low of $3,870. So, it is uncertain whether momentum can be sustained before consolidation or a pullback occurs. Short-term weakness was already apparent on Thursday, with trading occurring in the lower half of the session’s range, at the time of writing. Key support is near prior resistance at $4,082 and the 20-day moving average, now near $4,073. A daily close is needed above $4,082 to confirm the bullish signals.
First 20-Day Moving Average Reclaim Since September
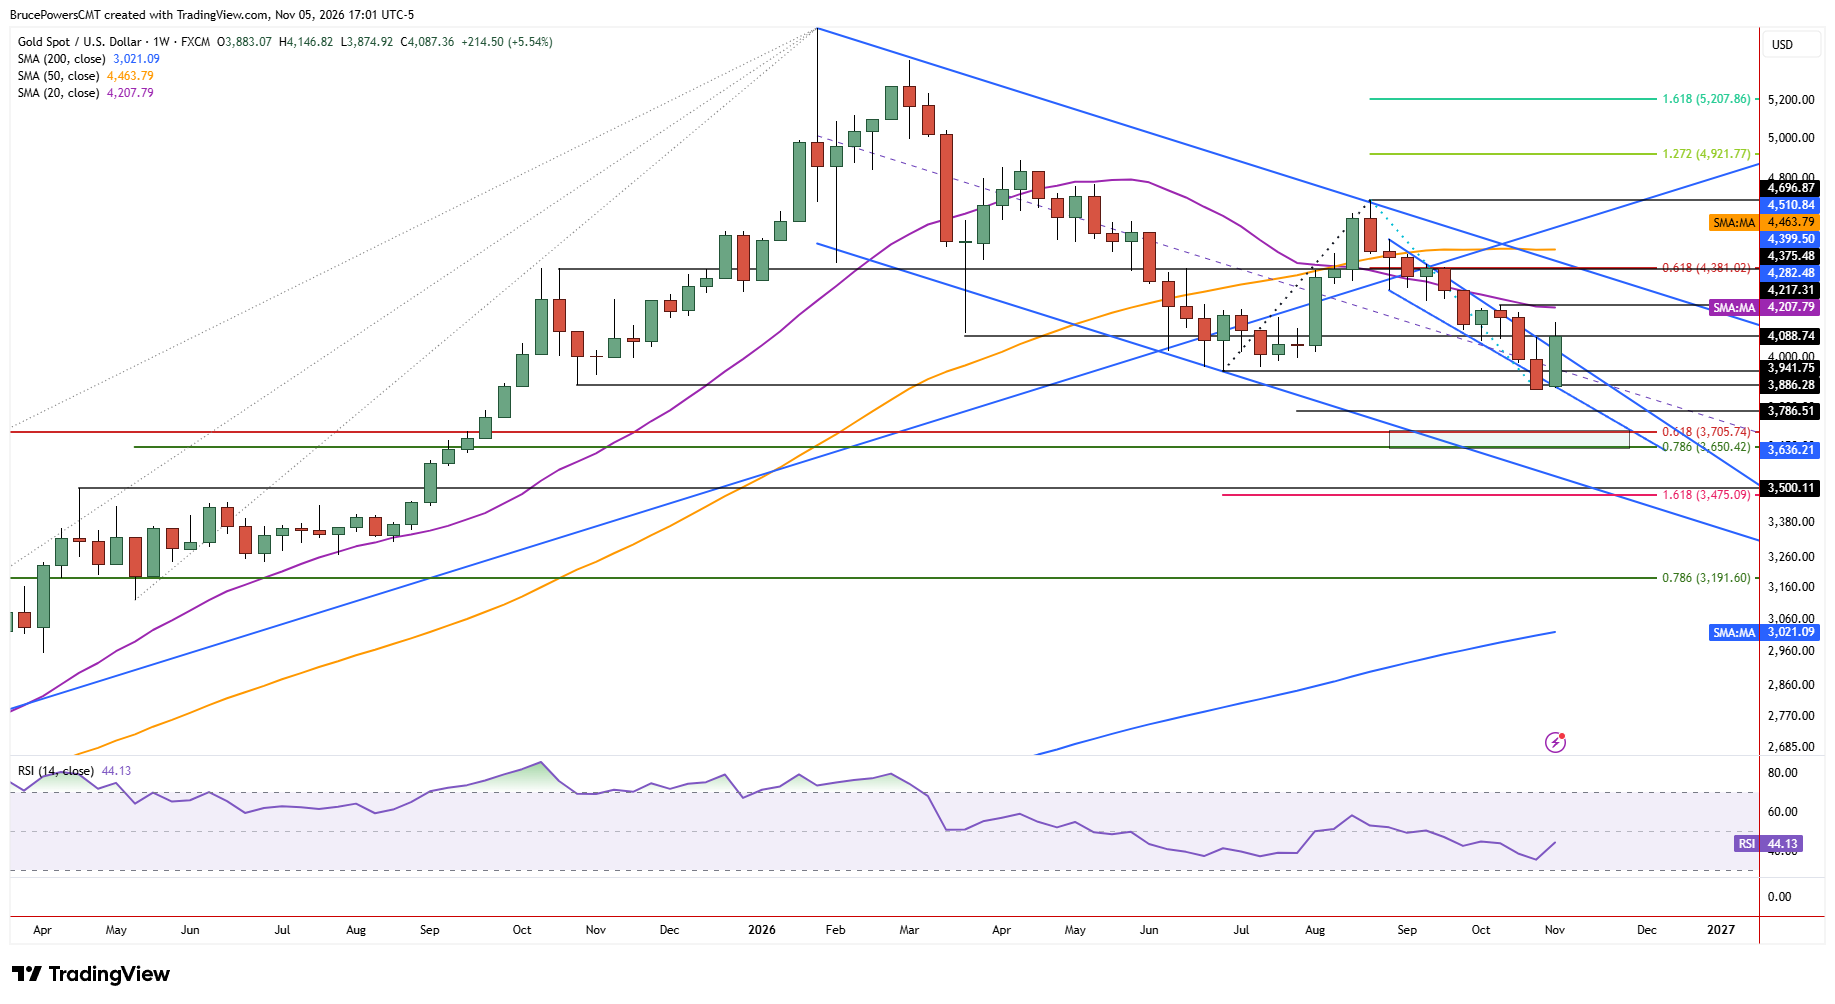
This is the first time that the 20-day moving average has been reclaimed since it broke as support on September 1. During the subsequent decline, it was tested as resistance and held, adding to its validation as a dynamic resistance indicator for the near-term downtrend. This doesn’t mean it will now hold as support, but it could.
Fibonacci Targets Meet Larger Channel Resistance
On the upside, there are two potential initial resistance areas that standout. First, is the recent lower swing high of $4,217 from mid-October, and the second is the 61.8% Fibonacci retracement of the decline at $4,381. There is also concern about resistance near the top downtrend line of the larger falling channel. Since a rally from current levels is occurring in a larger declining channel, its boundaries define important support and resistance area. Along with the failed attempt to reclaim the 200-day moving average during the prior advance to $4,967, the larger pattern is bullish in gold, and rallies will be counter the larger trend until an upside breakout of the channel confirms.
If you’d like to know more about how to trade gold and silver, please visit our educational area.