


Weekly Breakout Loses Momentum
Gold continued to struggle to maintain its recent strength during Wednesday’s session, following an upside breakout last week that signaled a bullish reversal on the weekly chart. Sellers drove gold lower to test key support levels following that breakout. A higher weekly low of $3,875 was established last week, making that level a key support area.
Additional signals supported the bullish implications of the weekly breakout. Both the downtrend line and 20-week moving average were recovered during the advance before resistance was found at last week’s high of $4,147. That level was then exceeded briefly this week to a high of $4,148. However, the breakout attempt failed to confirm with a daily close above last week’s high, contributing to the current short-term weakness.
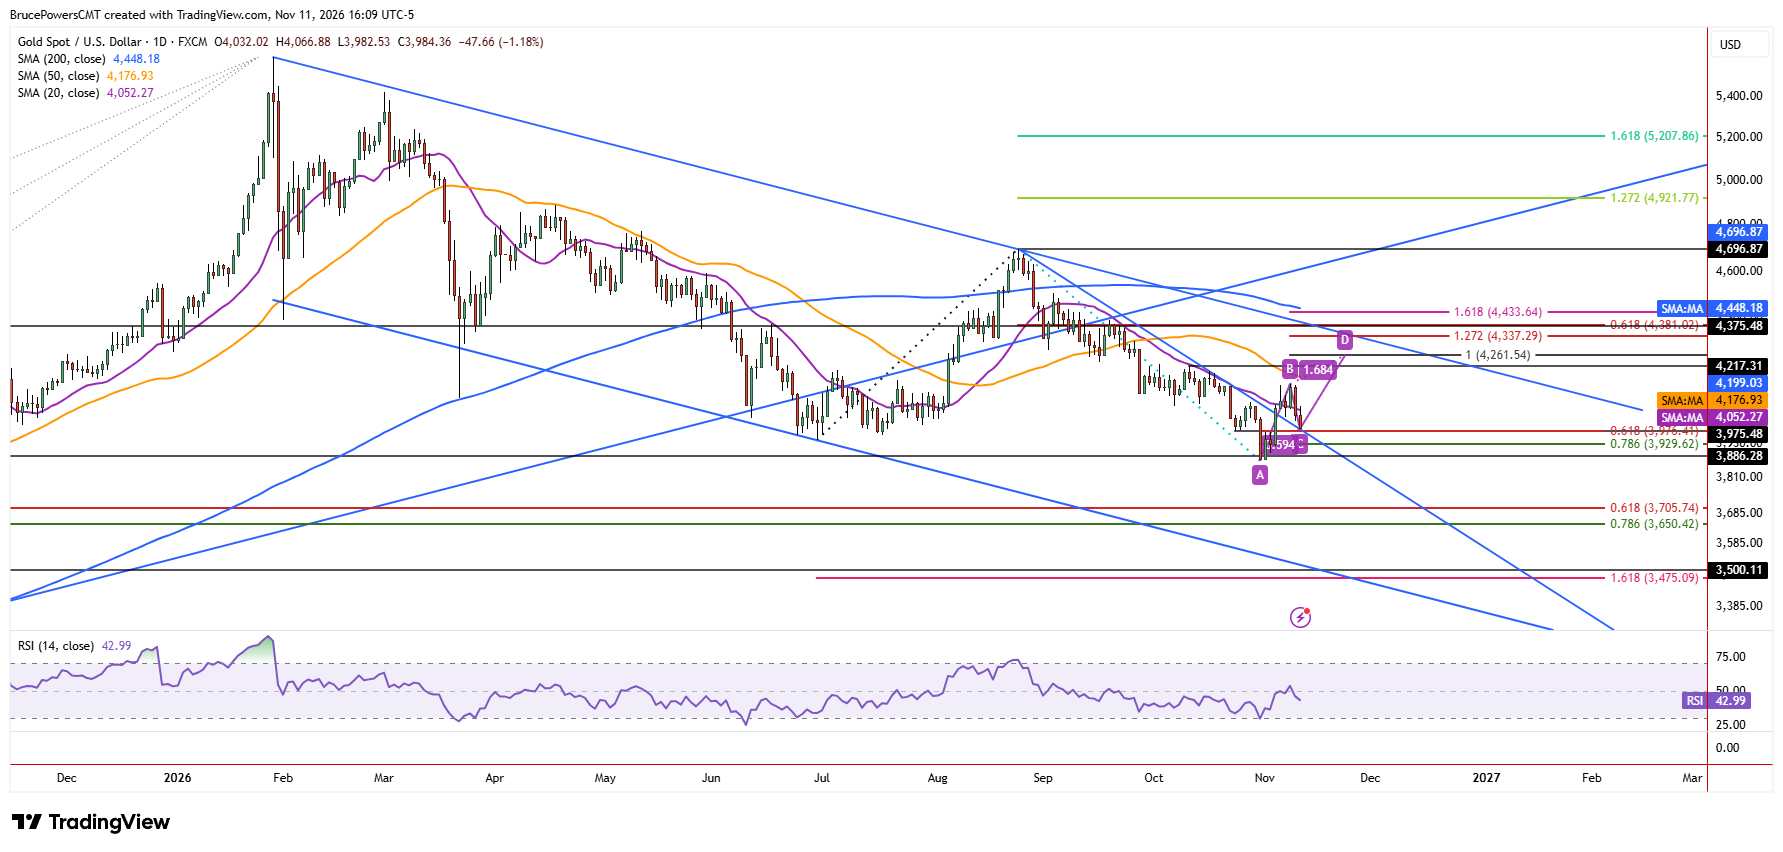
Trendline Reclaim Faces Resistance
So far, this is typical behavior following an upside breakout near the bottom of a downtrend. Once an advance rises above resistance, it can be followed by a pullback of some degree to test prior resistance as support. For gold, the key reference is the declining trendline, with additional support from the 20-day moving average, now near $4,052. But the moving average has not been cleared decisively, as it remains a potential resistance barrier during the current consolidation.
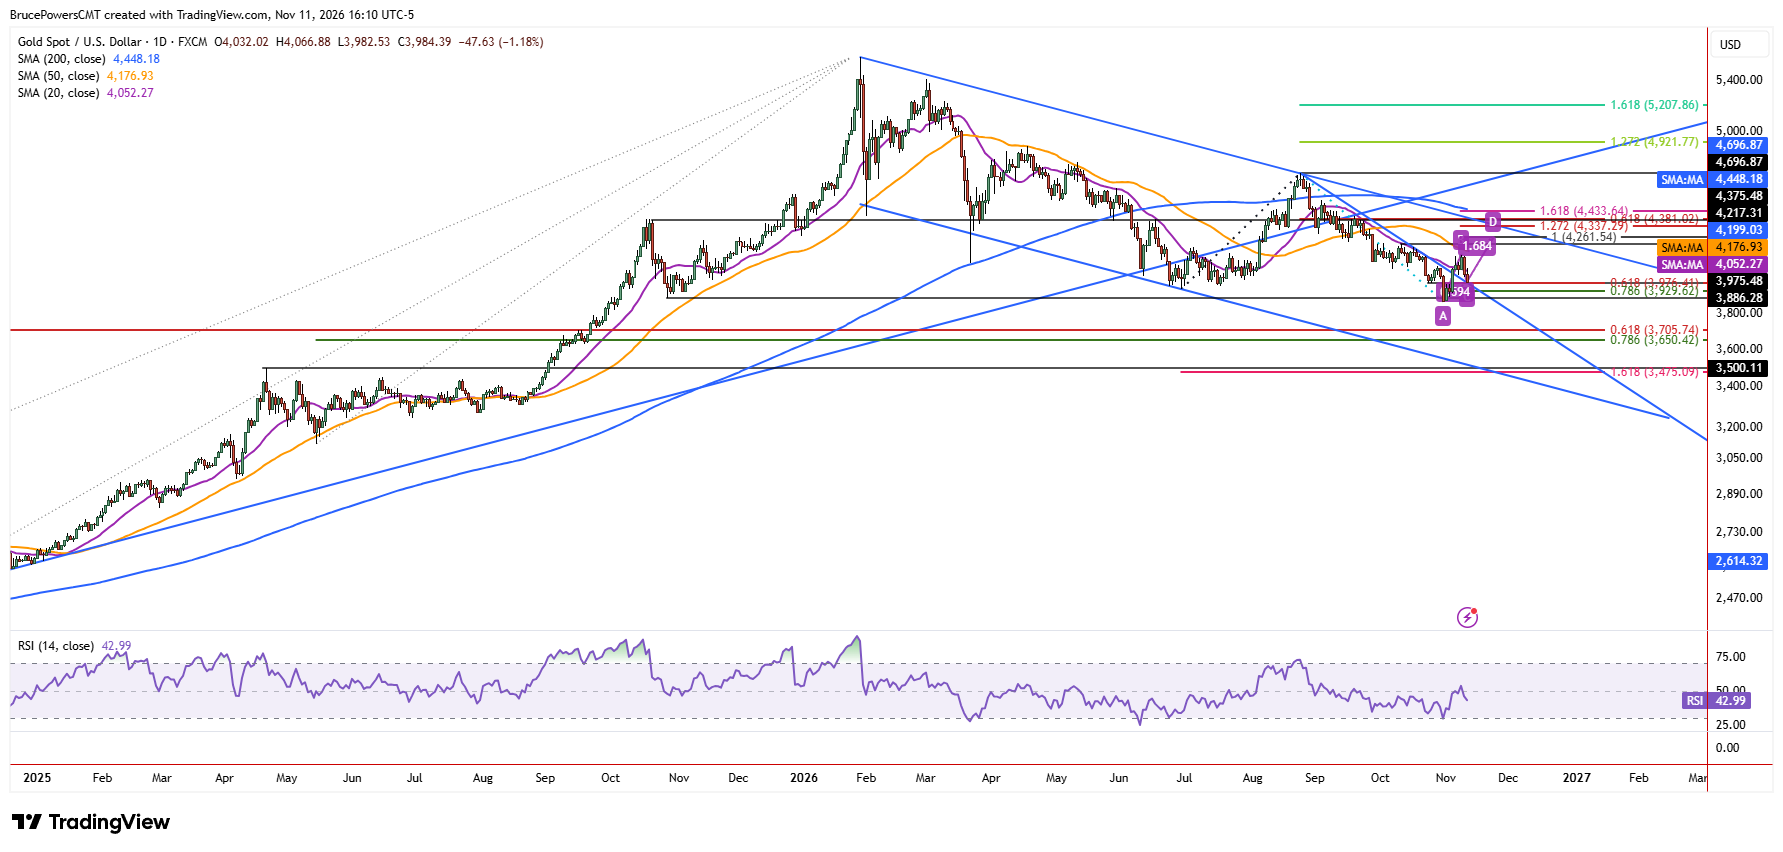
Fibonacci Confluence Offers Buyers Another Opportunity
Support near the trendline is reinforced by several indicators. The 61.8% Fibonacci retracement of the prior advance is at $3,976, aligning with a swing low from October. The current pullback is the first since last week’s bullish reversal signal, possibly providing a new opportunity to attract demand. A higher swing low could set the stage for an extension of last week’s advance and provide further confirmation of the bullish reversal. The confluence of support adds to the significance of this zone, which could offer buyers a second opportunity to establish control.
ABCD Projection Points to Higher Targets
If Wednesday’s low results in a higher swing low, that could mark the beginning of the next leg up for gold. In that case, a rising ABCD pattern suggests an initial upside target near $4,262, where the second advance from the October corrective low would match the magnitude of the first advance.
If reached, gold would first move above the 50-day moving average near $4,177, followed by a potential bullish reversal signal on a breakout above the lower swing high of $4,217 from October. This makes the ability to hold the current support zone particularly important in determining whether last week’s bullish breakout can develop into a more sustained recovery.
Gold Price Forecast
Every new Gold analysis as it publishes, today's technical signal and key levels, live price — on one page.
See all Gold forecastsIf you’d like to know more about how to trade gold and silver, please visit our educational area.