


Downside Pressure Meets Consolidation
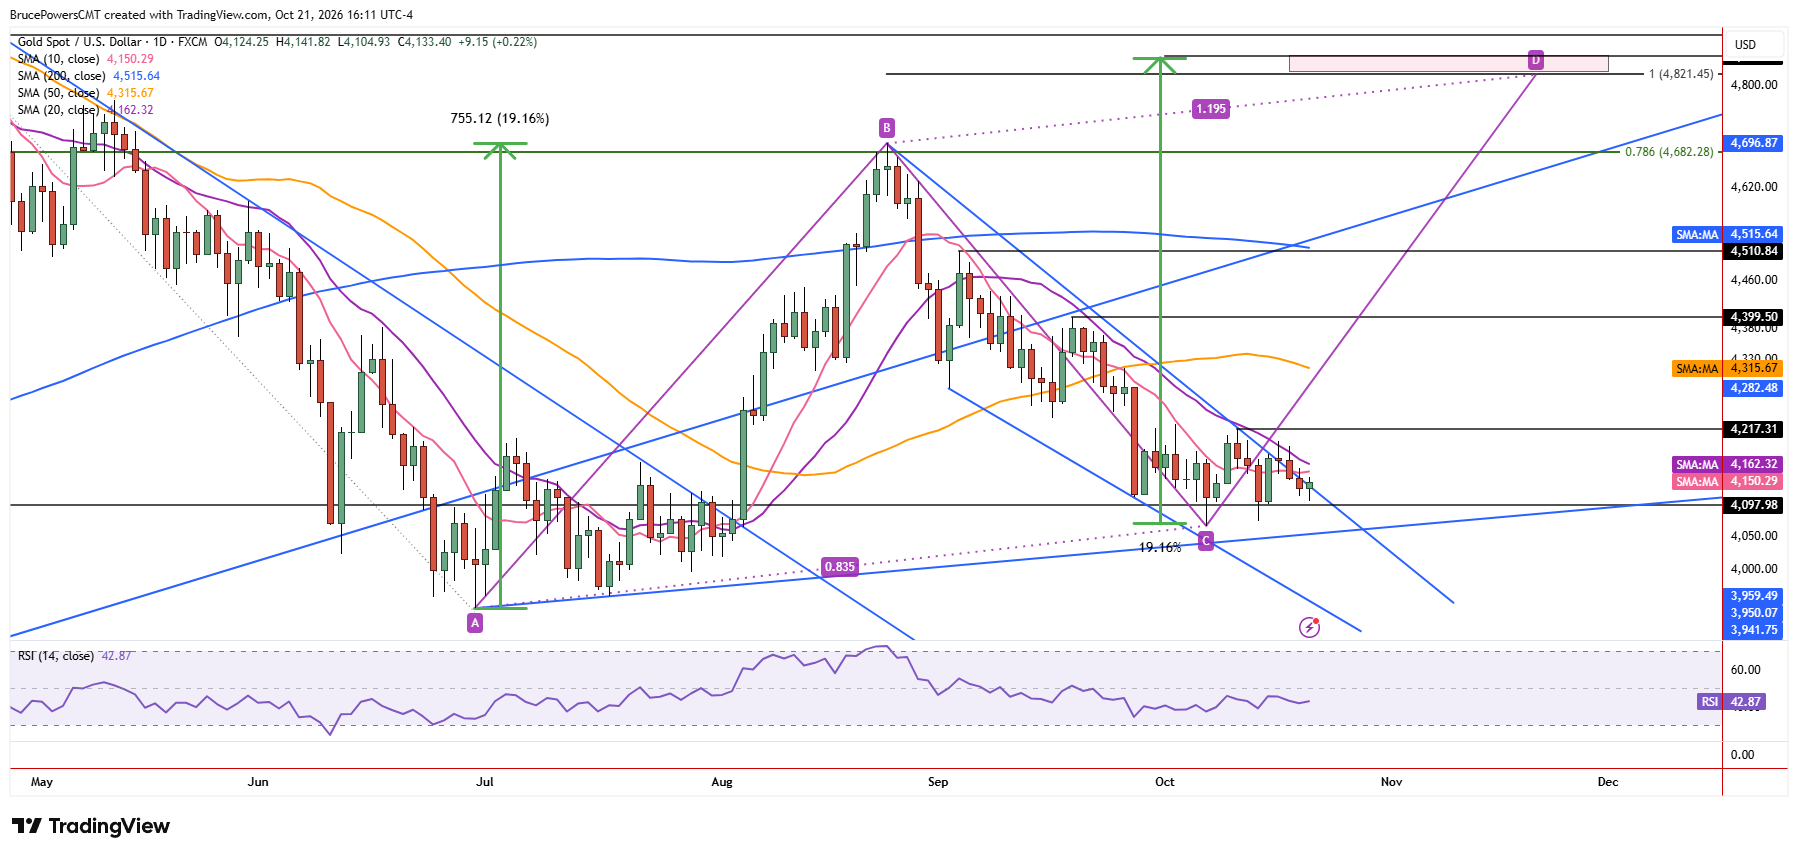
Gold weakened to a five-day low of $4,106 on Wednesday, once again aligning with the falling trendline representing dynamic resistance. The 20-day moving average near $4,162 was also tested as resistance on Friday and Monday, with price being rejected to the downside.
Recent price action relative to those two trend indicators shows continued downward pressure, as resistance has been seen near each. However, there have been no subsequent signs of bearish momentum indicating sellers were getting more aggressive. This leaves open the possibility of an eventual upside breakout from the three-week consolidation range, which has a high of $4,217 reached last week.
Upside Potential and Price Symmetry
If a bullish reversal signal for the downtrend triggers above the lower swing high of $4,217, gold could move higher as a new uptrend develops. That signal would establish a higher swing low and therefore the beginning of the second leg up from the low in June at $3,942 (A). The first full upswing from the June bottom saw an advance of approximately $755 (or 19%) to a high of $4,697. A similar percentage move from the recent low of $4,066 (C) would put gold near $4,847, with price symmetry near $4,821 (D).
Trendline Compression Nears a Decision Point
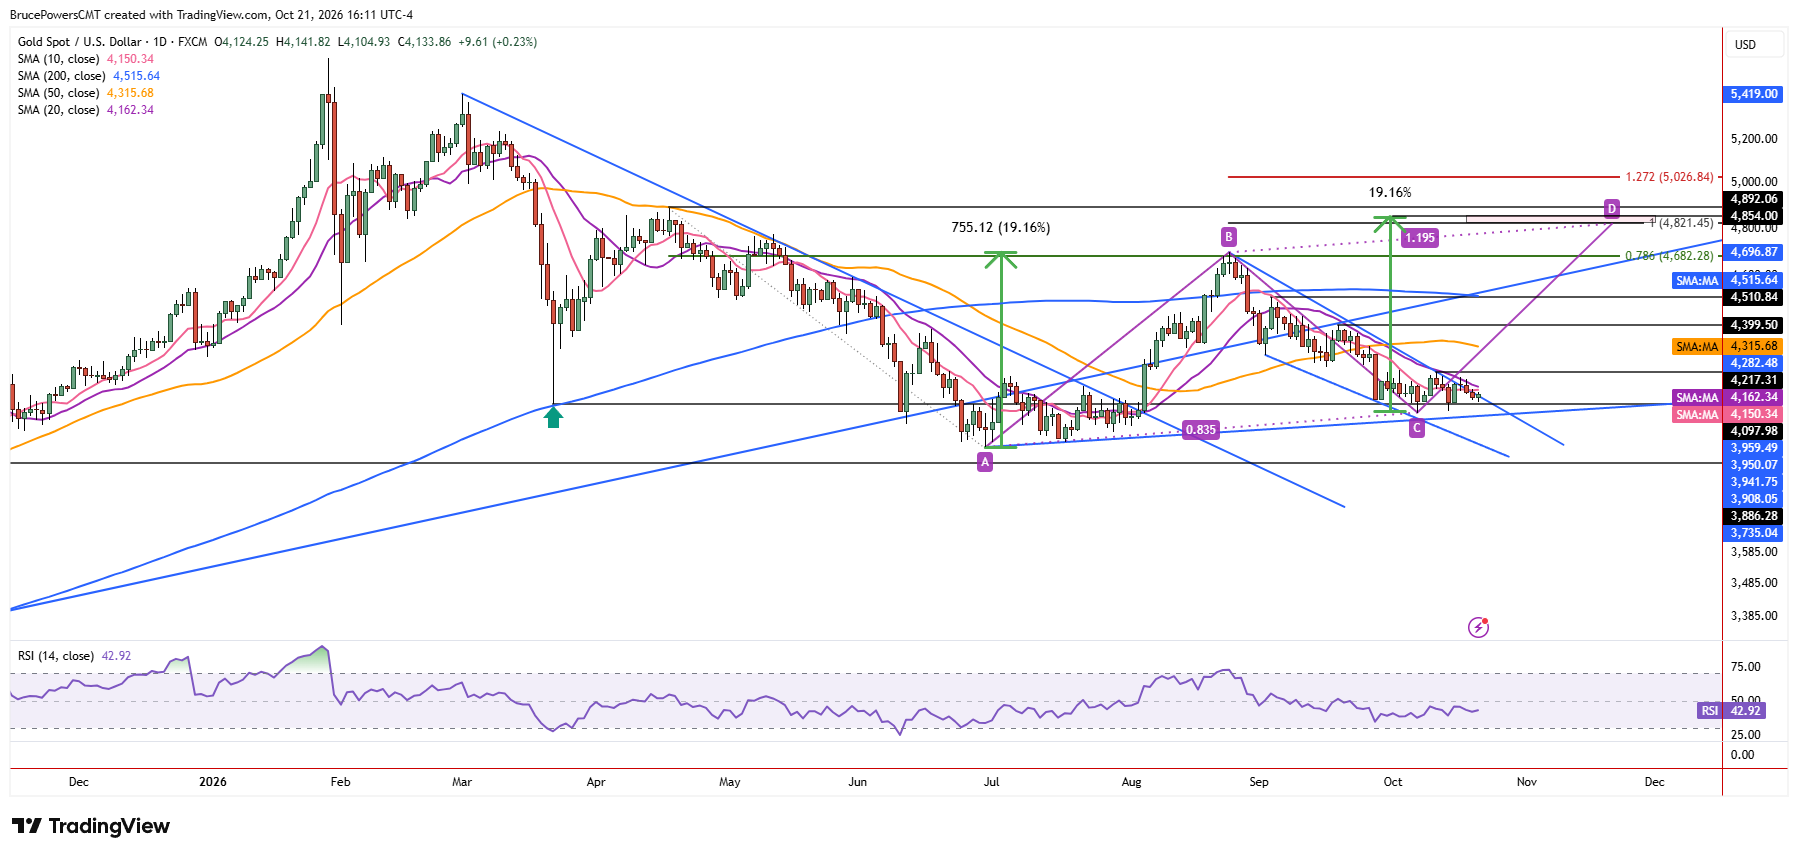
Given the potential for a spike in momentum once gold breaks out of consolidation, early signs of strength or weakness will provide clues as to when that time may be getting closer. Also, there is a rising trendline that crosses a declining trendline near October 28. The narrowing space between the two lines reflects the compression of price during consolidation. Therefore, a break of either trendline may point to the direction of the next move. The compression of price suggests that the move could be decisive.
Reversal Signals and Key Price Targets
An advance above Wednesday’s closing high would signal a one-day bullish reversal and the potential for another test of the 20-day moving average. A rise above Monday’s lower daily high, currently at $4,190, would provide a further sign of strength and increase the likelihood that gold could sustain a move back above the 20-day moving average. Initial upside targets are defined by potential resistance beginning with the 50-day moving average near $4,316, the lower swing high at $4,400, and a confluence zone near the early-September lower swing high. Key support remains at the low of $4,066 (C).