


Bearish Signals Challenge Temporary Support
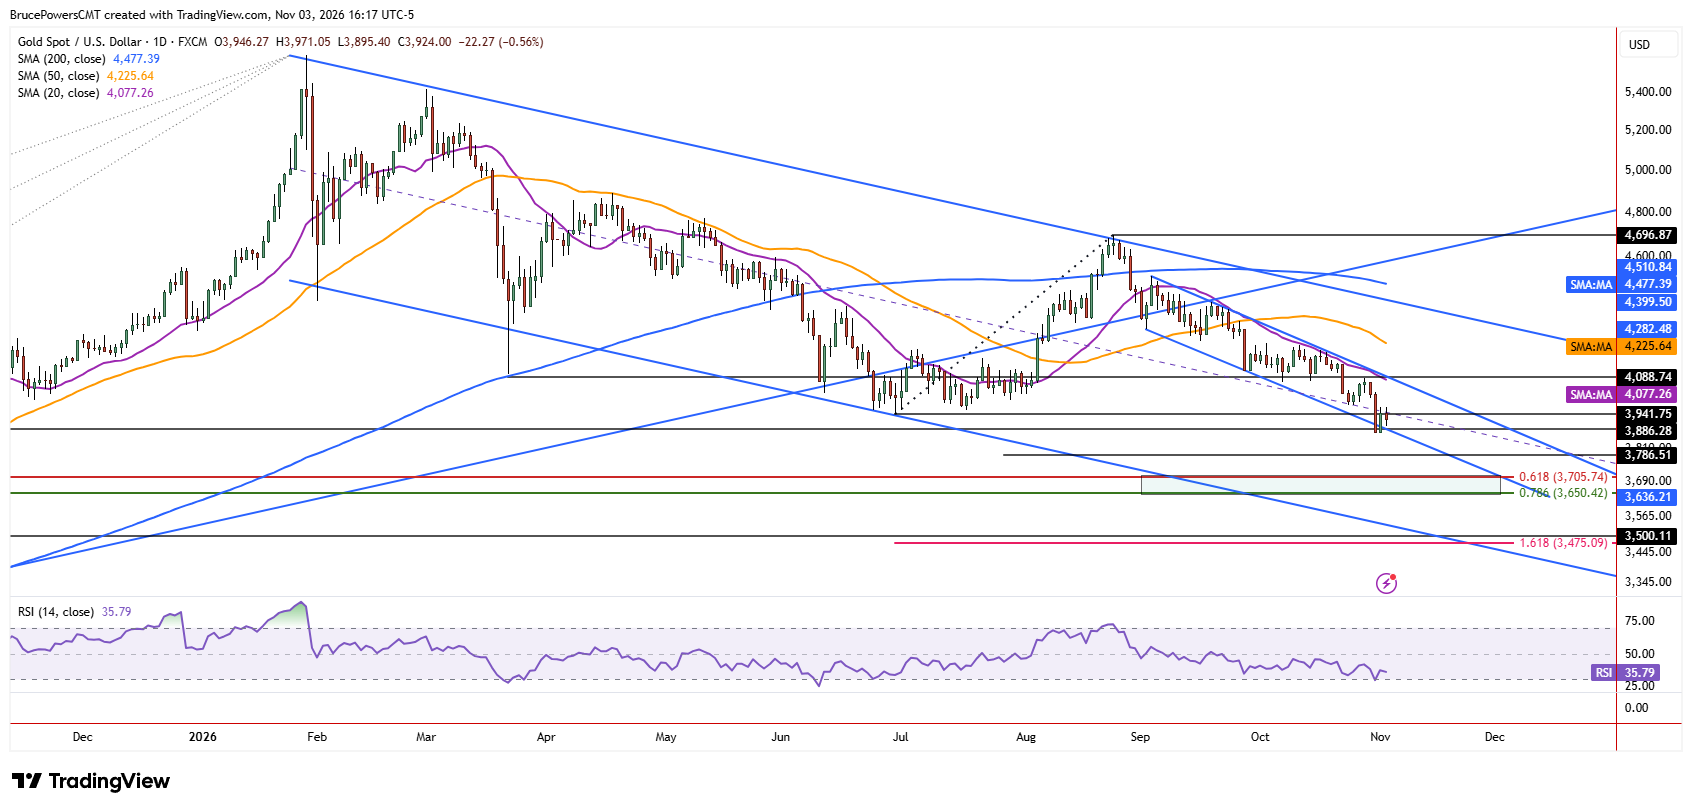
Gold continued to hold above support at last week’s low of $3,870 on Tuesday, as it consolidated for the second day within Friday’s wide range. This potential temporary support is reinforced by the lower boundary of a small falling channel and the higher swing low of $3,886 from October 2025. On Friday, the bearish continuation of the trend was confirmed with a weekly close below the lower swing low of $3,942 from June, along with a trend reversal signal below the October 2025 low. Both signals point to further downside pressure, unless there are clear indications of strengthening beyond a temporary bounce.
Recovery Faces Multiple Layers of Resistance
The current lower channel support zone suggests a possible advance to test resistance along the upper boundary of that formation. However, the smaller channel is contained within a larger declining trend channel, which suggests that lower prices may still be ahead. Key dynamic resistance is indicated by the falling 20-day moving average near $4,078, while the recent lower daily high of $4,082 provides an additional structural resistance level. A rally above that level would signal a bullish reversal of the current short-term decline. Otherwise, resistance is anticipated to turn price back down.
Former Support Now Caps Recovery Attempts
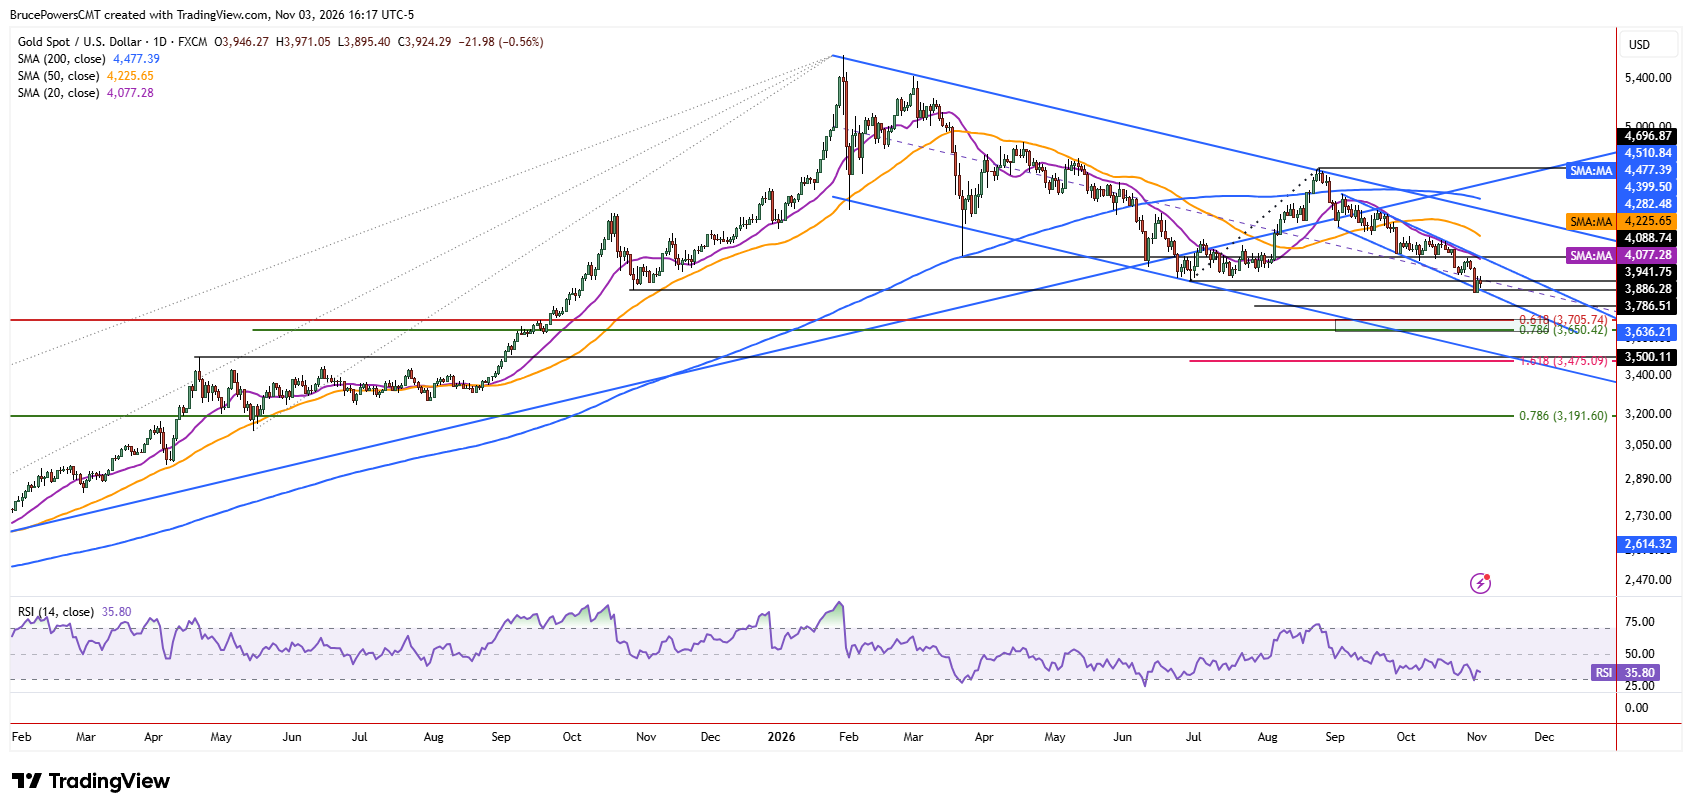
During the past two sessions, closing prices have reflected unsuccessful attempts to reclaim resistance near prior support from the October swing low at $3,942, as indicated by closing of the sessions. That is bearish behavior, showing continued downward pressure since prior key support has switched to resistance. Nonetheless, this remains a very short-term test and does not preclude an upside signal on a breakout above Tuesday’s high of $3,971.
Lower Channel Targets Come Into Focus
Alternatively, if the bearish trend extends below $3,870, lower potential targets become more likely to be tested. The decline that followed the recent lower swing high of $4,697 in August originated from resistance at the top of a larger declining channel. Now that both a bearish continuation and reversal signal have triggered, the lower boundary of the channel becomes a potential target. Adding to the bearish technical picture, Friday’s decline broke below support near the midline of the channel, which had previously acted as support at the October 23 swing low.
The first lower support level is a measured move target at $3,786. That is followed by a Fibonacci retracement zone from $3,706 to $3,650, reinforced by a short consolidation zone in September 2025. Further down, is the prior peak of $3,500 from April 2025, which begins a range of possible support defined by the consolidation range that followed that peak. For now, the ability to hold $3,870 is important, but a sustained breakdown would shift attention toward these progressively lower support targets.
Gold Price Forecast
Every new Gold analysis as it publishes, today's technical signal and key levels, live price — on one page.
See all Gold forecastsIf you’d like to know more about how to trade gold and silver, please visit our educational area.