


Persistent Selling Pressure Nears Potential Support
Gold continued to slide to new lows on Thursday, falling to $3,503 at the time of writing. Sellers remain in control and could push prices lower before the close. The extension of the decline accelerated on Wednesday, as represented by three consecutive full-bodied red candles in a row, referred to as three black crows in candlestick analysis. The pattern reflects persistent selling pressure, with sellers maintaining control throughout each session. Although this is a continuation pattern, gold is fast approaching its next key potential support zone, where buyers may begin to emerge.
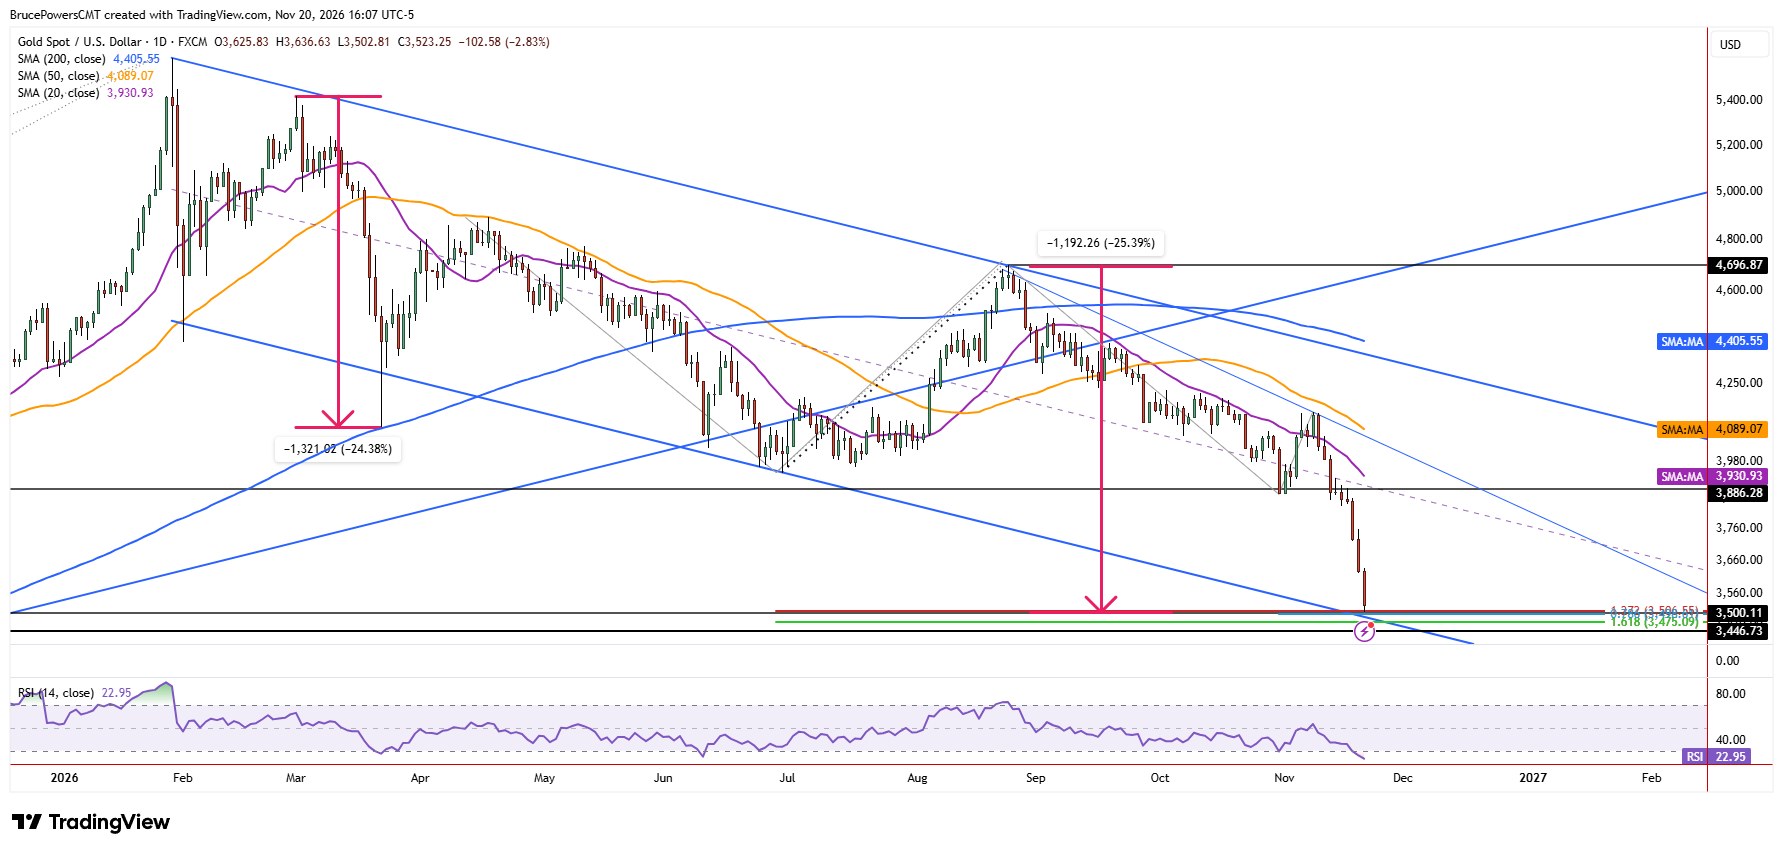
Measured Move Highlights $3,500–$3,447 Support
When measured from Wednesday’s high, gold had fallen by approximately 8.8%, and 15.6% from the recent swing high reached last week. More importantly, the decline from the larger swing high of $4,679 was around 25%, as of Friday’s low. That measured move exceeded the largest decline since the January peak, which was approximately 24.4%.
This comparison suggests that the current decline is becoming extended. The measured move identifies a potential support level, reinforced by a confluence of other technical indicators and price structure. Together, they identify a key support zone from around $3,500 to $3,447 that may begin to attract buyers.
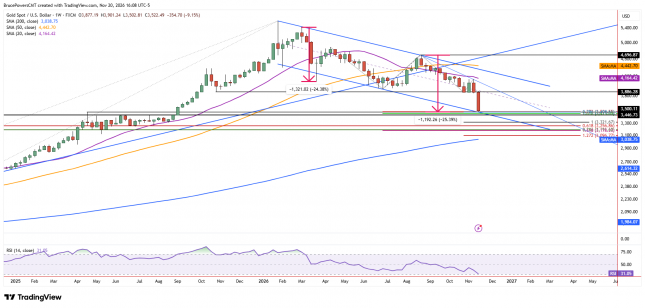
Oversold Conditions Strengthen Support Confluence
The extension of the measured move suggests gold may be getting overextended to the downside. A steeper angle of descent and the lowest relative strength index (RSI) reading since September 2023 further support this possibility. Nevertheless, until there are signs of strength, the potential support zone remains just that – a possibility rather than a confirmed bottom. However, it is supported by the confluence of several indicators and price structure from a consolidation range beginning in April 2025. The zone is also reinforced by the lower boundary of a falling channel.
Buyers Need to Confirm a Reversal
Gold could continue to weaken into this price range while remaining above the lower channel boundary, given its downward slope. But if gold can establish support and signal a bullish reversal near the lower channel boundary, that could result in a sharp advance toward potential resistance levels. For now, though, sellers are in control and there is no sign of strength. Consequently, the developing support confluence warrants attention, but a bullish reversal signal is still needed before the balance of control can shift back to buyers.
Gold Price Forecast
Every new Gold analysis as it publishes, today's technical signal and key levels, live price — on one page.
See all Gold forecastsIf you’d like to know more about how to trade gold and silver, please visit our educational area.