


Fibonacci Support Under Pressure
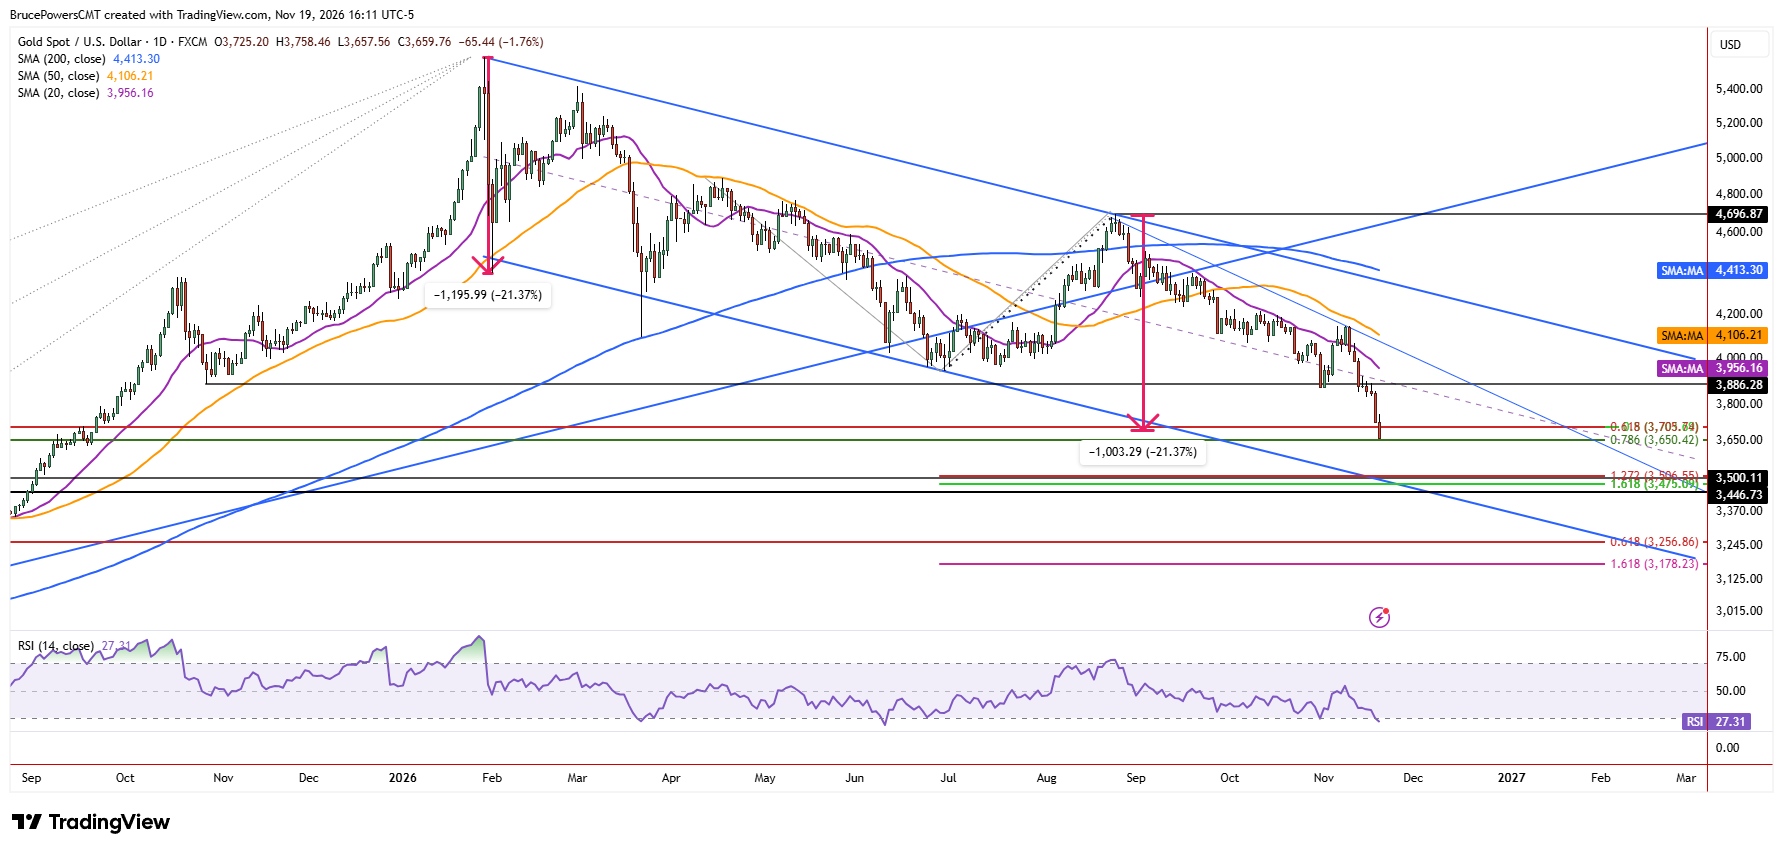
Gold declined to a new low of $3,667 during Wednesday’s session, as it entered a potential support range from $3,706 to $3,650. That range is defined by two Fibonacci retracement levels and a small consolidation pattern from September 2025. The top of the range at $3,706 was identified by the alignment of two Fibonacci levels, and it was broken with little hesitation.
However, there was a small intraday bounce, showing that the level was recognized in price action. There is also a measured move that completes within the range, matching the magnitude of the largest decline that followed the $5,597 peak in January, which was 21.4%. That suggests a potential support zone and adds to the bearish implications of a drop below $3,650.
Deeper Support Zones Emerge
The acceleration in bearish momentum since Wednesday’s session and the subsequent failure of key technical support levels suggest that gold may continue lower until it reaches a more significant support zone. If the $3,650 area fails as support, the next lower level is anchored by the prior peak in April 2025 at $3,500 and reinforced by a couple of Fibonacci levels that extend to $3,475. However, the 2025 peak defines the top of a price range that shows a wider potential support zone, with $3,447 having been tested several times during its formation. Given that, the initial support range could be extended to that lower level.
Falling Channel Reinforces Downside Targets
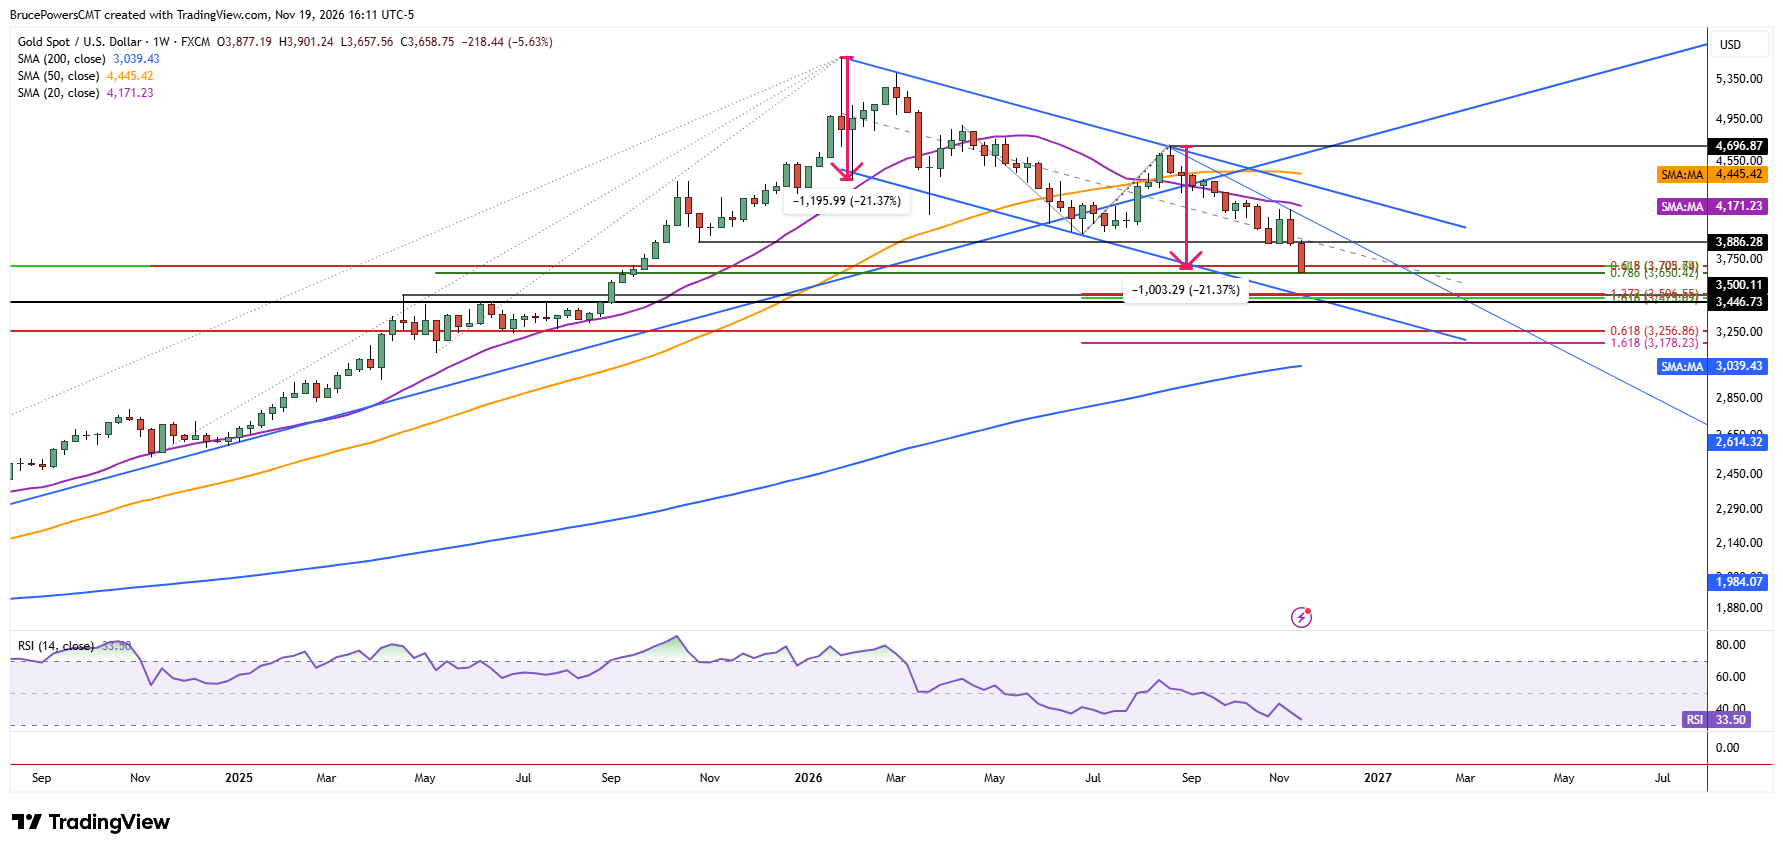
The upper boundary of the initial support range, as defined above, currently aligns near the lower boundary of a falling trend channel that defines the bearish trend. Since the channel boundary is currently cutting through that range, it reinforces the support zone and therefore the potential for gold to reach it before the current decline completes.
Countertrend Rallies Face Overhead Resistance
This means that countertrend rallies that occur before a test of support at $3,500 or lower are likely to be limited in magnitude and face overhead resistance. Keep in mind that gold only recently broke key support on Wednesday. Consequently, a bearish extension may still be in its early stages, with the next significant test being whether the $3,650 support area can hold.
If you’d like to know more about how to trade gold and silver, please visit our educational area.