


Sellers Retain Control Following Bearish Breakdown
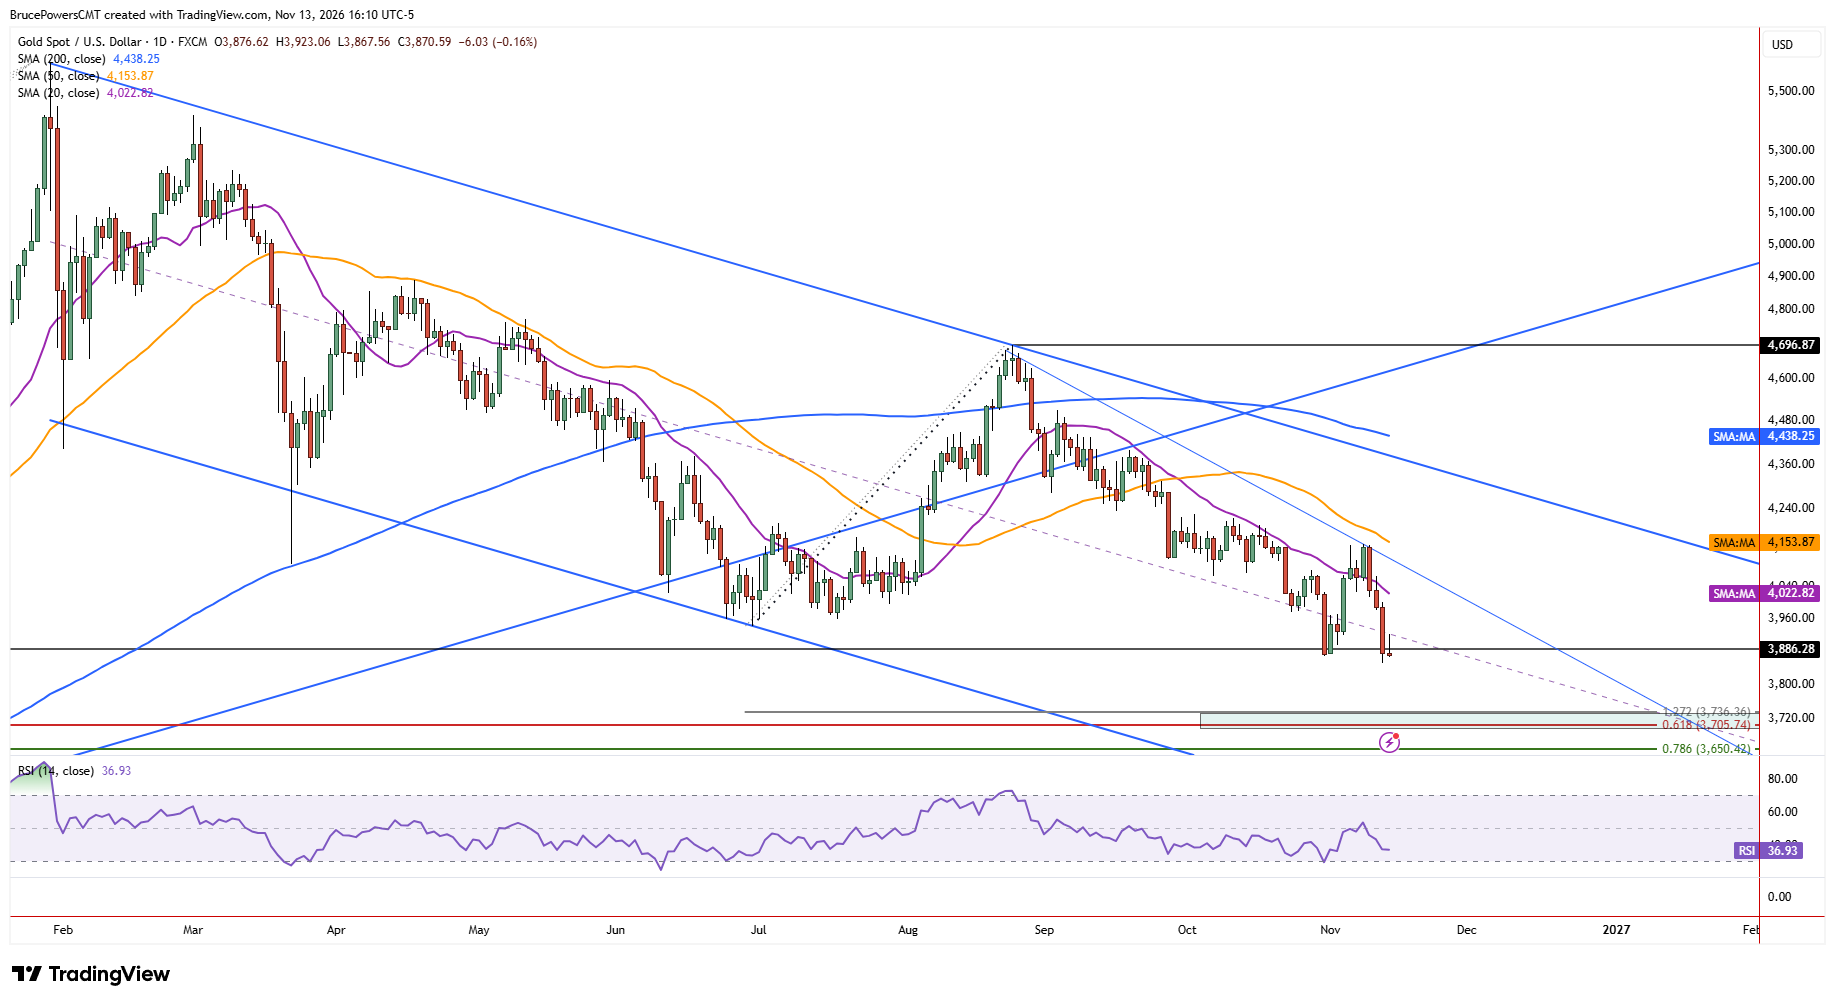
Gold remained under pressure on Friday, following a new bearish trend continuation signal triggered during Thursday’s session when prices declined below $3,870. On Friday, gold consolidated in a narrow daily range from $3,868 to $3,923, located near the prior lows and in the lower half of Thursday’s range, suggesting that sellers remained in control heading into the weekend.
Although support could continue to hold above Thursday’s new low of $3,852, rallies from here are likely to encounter resistance that turns gold back down, with the potential for new lows. Two key potential resistance levels are Thursday’s high of $4,001 and the 20-day moving average, currently near $4,023.
Declining Channel Reinforces Downside Pressure
Meanwhile, the bearish trend is anticipated to continue towards a test of lower support levels. The declining trend channel supports this scenario, since the current short-term decline followed the recent swing high of $4,697, which defined the upper boundary of the channel. Subsequently, support was seen near the midline of the channel, with price touching it for three consecutive days in late October. That showed the channel structure continuing to impact the price of gold.
This week’s decline was the second drop below the midline since then, and it was confirmed with a daily close below it. Also, Friday’s high directly tested resistance at that midline, further validating it as an indicator for current price action. Once prior support is converted into resistance, the decline is signaling it may be ready to continue. This reinforces the bearish implications of Thursday’s breakdown below the prior lows.
Weekly Candlestick Pattern Adds to Bearish Signals
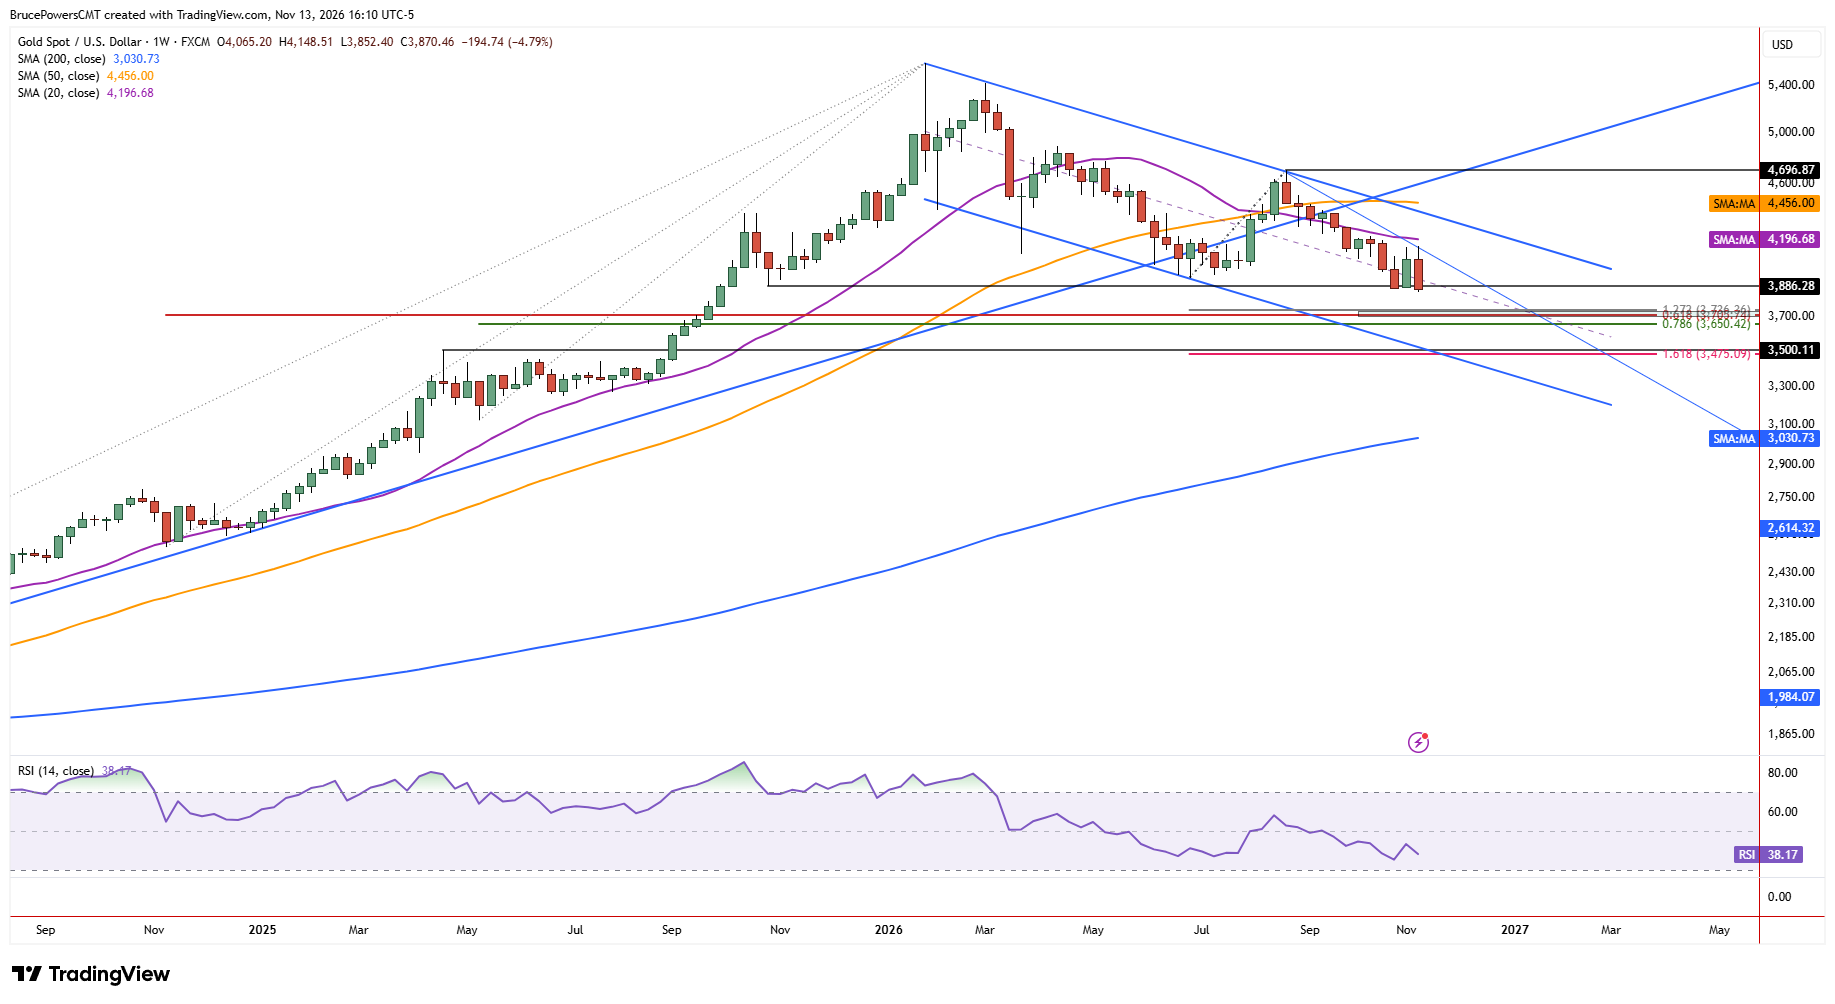
In addition, the weekly chart is on track to complete a bearish engulfing candlestick pattern this week, adding another bearish signal. Given the continuing bearish signals and channel structure, the potential to eventually test support near the lower boundary of the channel increases.
Fibonacci Support Defines Next Downside Targets
Therefore, a decisive decline below this week’s low of $3,852 would provide a new bearish trend continuation signal, with gold first heading toward a potential support confluence range from $3,736 to $3,705, consisting of the 127.2% Fibonacci extension of the prior advance from the June low and the 61.8% Fibonacci retracement of the prior advance, respectively. The next support level below that range is the 78.6% Fibonacci retracement of a prior advance at $3,650. A break below $3,852 would therefore reinforce the bearish continuation signal that has kept gold under pressure, opening the way toward these lower support targets.
Gold Price Forecast
Every new Gold analysis as it publishes, today's technical signal and key levels, live price — on one page.
See all Gold forecastsIf you’d like to know more about how to trade gold and silver, please visit our educational area.