


Thursday’s Bearish Continuation
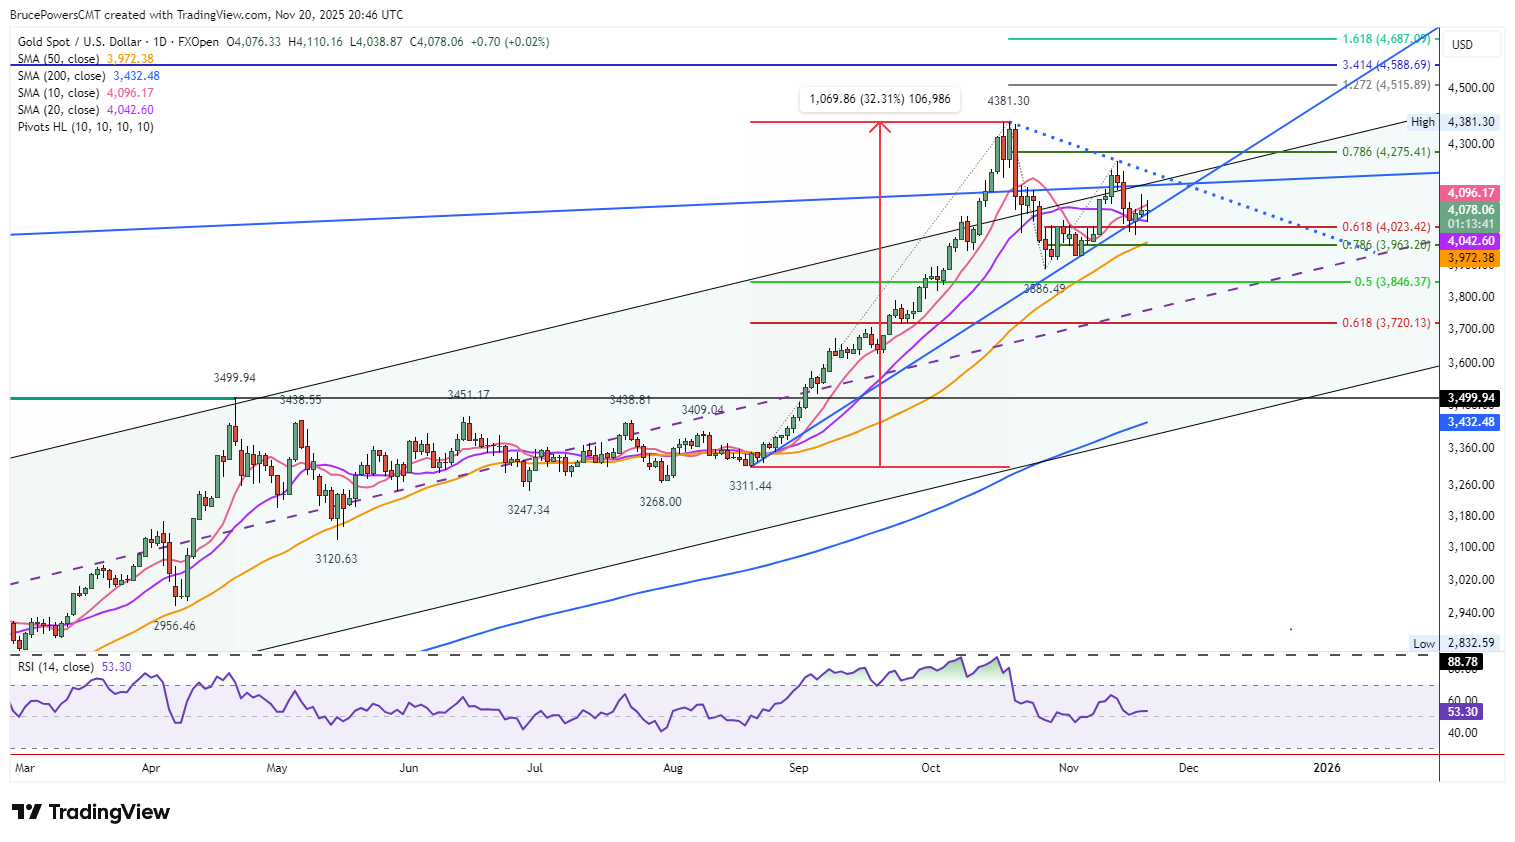
Bears maintained control Thursday, generating a lower daily high of $4,110 and low of $4,039 as early buying ran into immediate resistance near the 10-day average. The failed breakout attempt from yesterday repeated, quickly reversing and pushing price back toward the 20-day average for another test.
Four-Day Struggle
Since establishing a higher interim swing low at $3,998 on Tuesday—setting up potential for a second leg higher from October’s $3,886 base—gold has shown almost no upside conviction. Rally attempts repeatedly meet supply and fade, keeping the entire structure fragile.
Critical Support Levels
The $3,998 low remains the immediate bull-bear pivot. A decisive drop below confirms failure of both the 20-day average and 61.8% Fibonacci retracement near $4,023, targeting the rising 50-day average at $3,975 aligned with the 78.6% retracement at $3,963.
Deeper Objectives
Should that confluence crack, the October $3,886 swing low enters focus, followed by the 50% retracement of the August–October upswing at $3,846. Until proven otherwise, the broader pattern retains an upward bias as long as the trendline/20-day zone holds as a dynamic support zone.
Bullish Reversal Trigger
An advance and close above Thursday’s $4,110 high would create a one-day bullish reversal off key support. Quick follow-through above Wednesday’s $4,133, then the $4,245 lower swing high, would restore buyer momentum. Otherwise, a period of consolidation could unfold.
Gold Price Forecast
Every new Gold analysis as it publishes, today's technical signal and key levels, live price — on one page.
See all Gold forecastsWeekly Shooting Star Context
The weekly chart is forming an inside week in the lower half of last week’s $3,997–$4,245 range, which ended with a potential shooting star and lower swing high. A decisive break below last week’s $3,997 low triggers the bearish weekly candle.
Outlook
Gold’s repeated failure to hold early gains keeps bears in the driver’s seat. Defend $3,998–$4,039 to protect the higher-low structure and target $4,245 plus; violation opens $3,975–$3,963 quickly. A weekly close below $3,997 activates the shooting star and shifts intermediate bias lower—watch tomorrow’s settlement closely.
For a look at all of today’s economic events, check out our economic calendar.