


Post-Election Rally Meets Trend Resistance
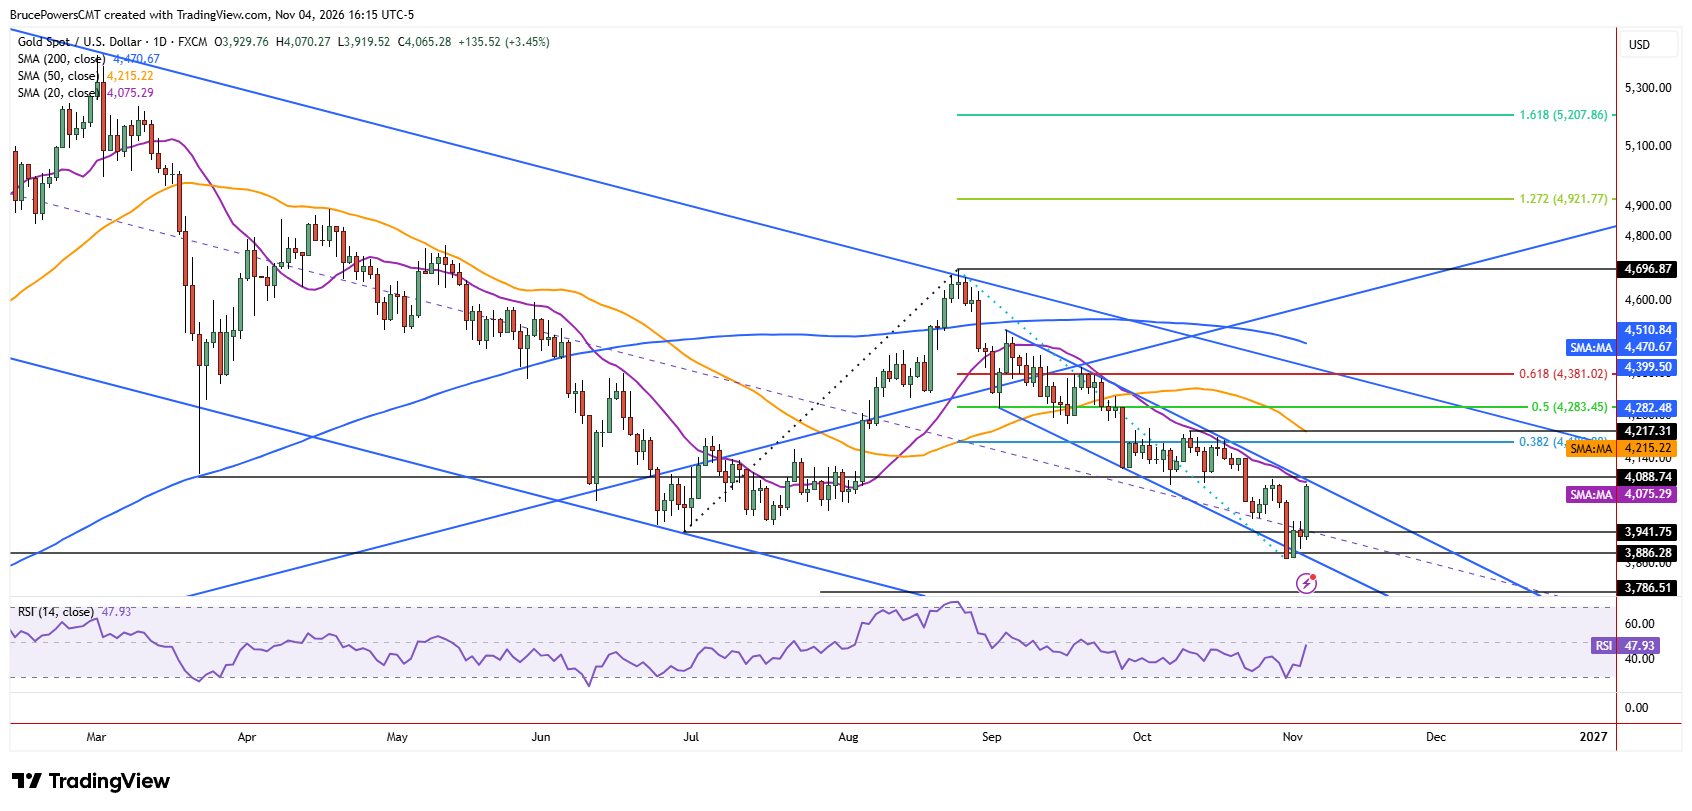
The post-election rally in gold on Wednesday brought buyers to a critical test of trend resistance near the 20-day moving average, potentially setting up a bullish reversal if key resistance levels can be reclaimed. Gold rallied to a six-day high of $4,070 on Wednesday, following the U.S. midterm elections, in which the Democratic Party won a majority in Congress. Key trend resistance was tested near the 20-day moving average, currently near $4,075. That average was the first upside target for gold if buyers took control.
The test of resistance at that average adds to its significance, as a sustained reclaim would provide an additional sign of strength. Wednesday’s high now has greater significance, with a subsequent rally above it potentially providing further confirmation of bullish momentum. Although the session is not quite complete, buyers remain in control at the time of writing, and the top of the day’s range could be higher by the close. The ability to maintain that control into the close will therefore be important.
Critical Resistance Zone Comes Into Focus
Nevertheless, the test of resistance near the downtrend line also occurred during Wednesday’s session, and the high was close to the recent interim lower swing high of $4,082. That price area marked a key support zone that held for 10 days during the recent decline and a rally above it would provide a bullish reversal signal for the decline. However, the prior consolidation range that generated support also places the March spike low of $4,098 nearby, adding to the initial resistance zone. Consequently, a sustained advance through this area would represent a more meaningful improvement in the short-term technical picture.
Confirmation Levels Define Bullish Reversal Potential
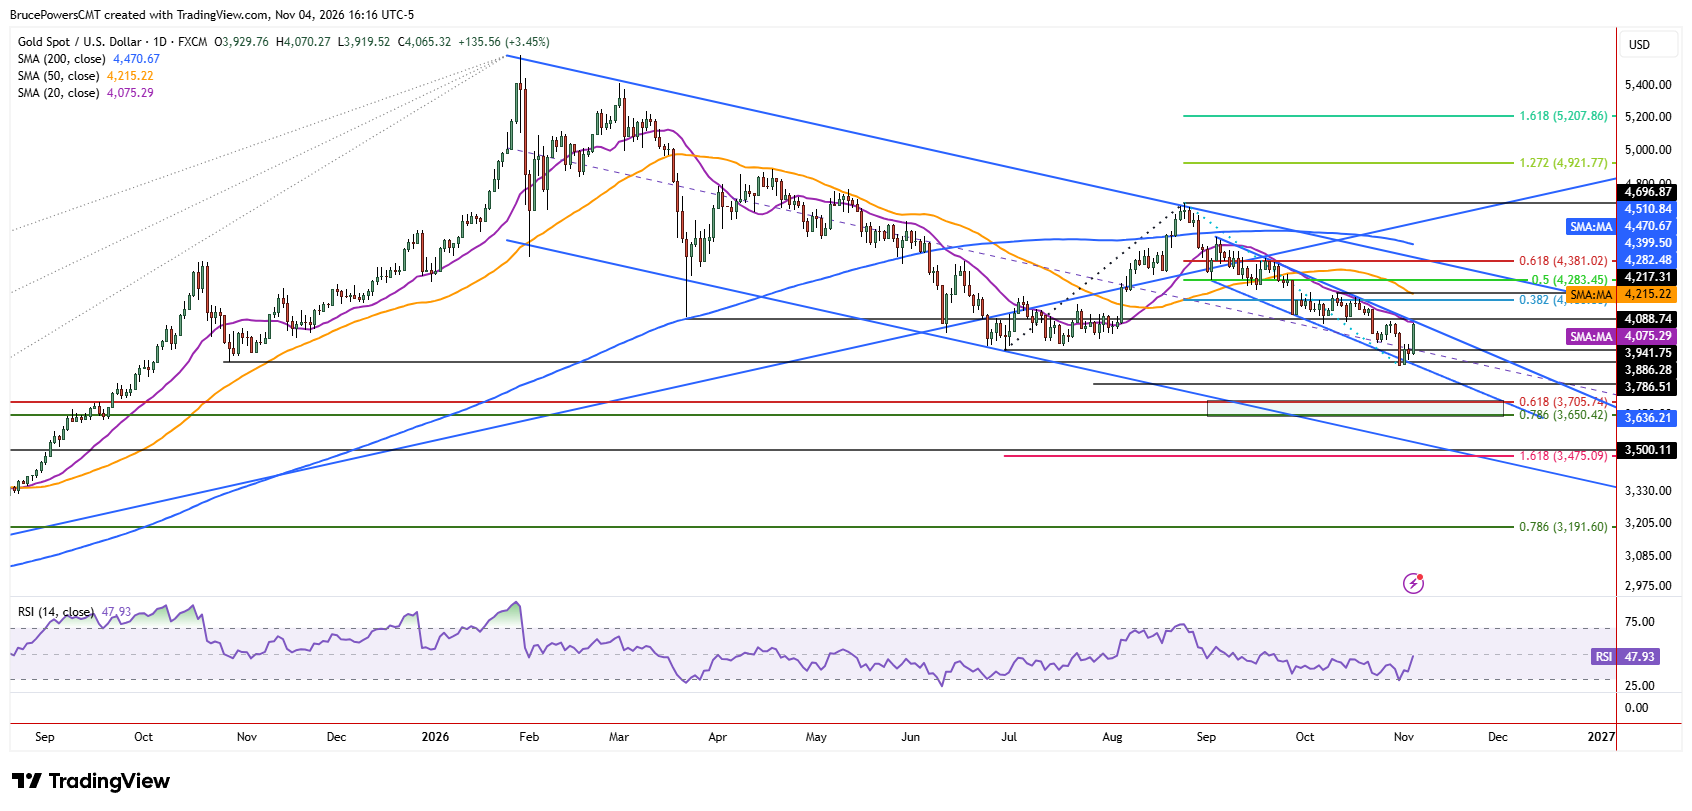
An alternative scenario is that Wednesday’s strength proves unsustainable, at least initially, and sellers regain control before a rally above $4,098 occurs. If support is then found above the 20-day average during a pullback, the potential for further upside may be validated. There is also a higher resistance level near $4,155, established by three lower daily highs during the recent decline.
A recovery of that level would further confirm strength during an advance toward the lower swing high of $4,217 from October. That higher level is a key component of the decline that followed the August high, and its recovery would trigger a more significant bullish reversal signal. Thus, the progression from reclaiming $4,082 to overcoming $4,155 and eventually $4,217 provides a series of increasingly important confirmation levels.
If you’d like to know more about how to trade gold and silver, please visit our educational area.