


Counter-Trend Rally Faces Downside Risk
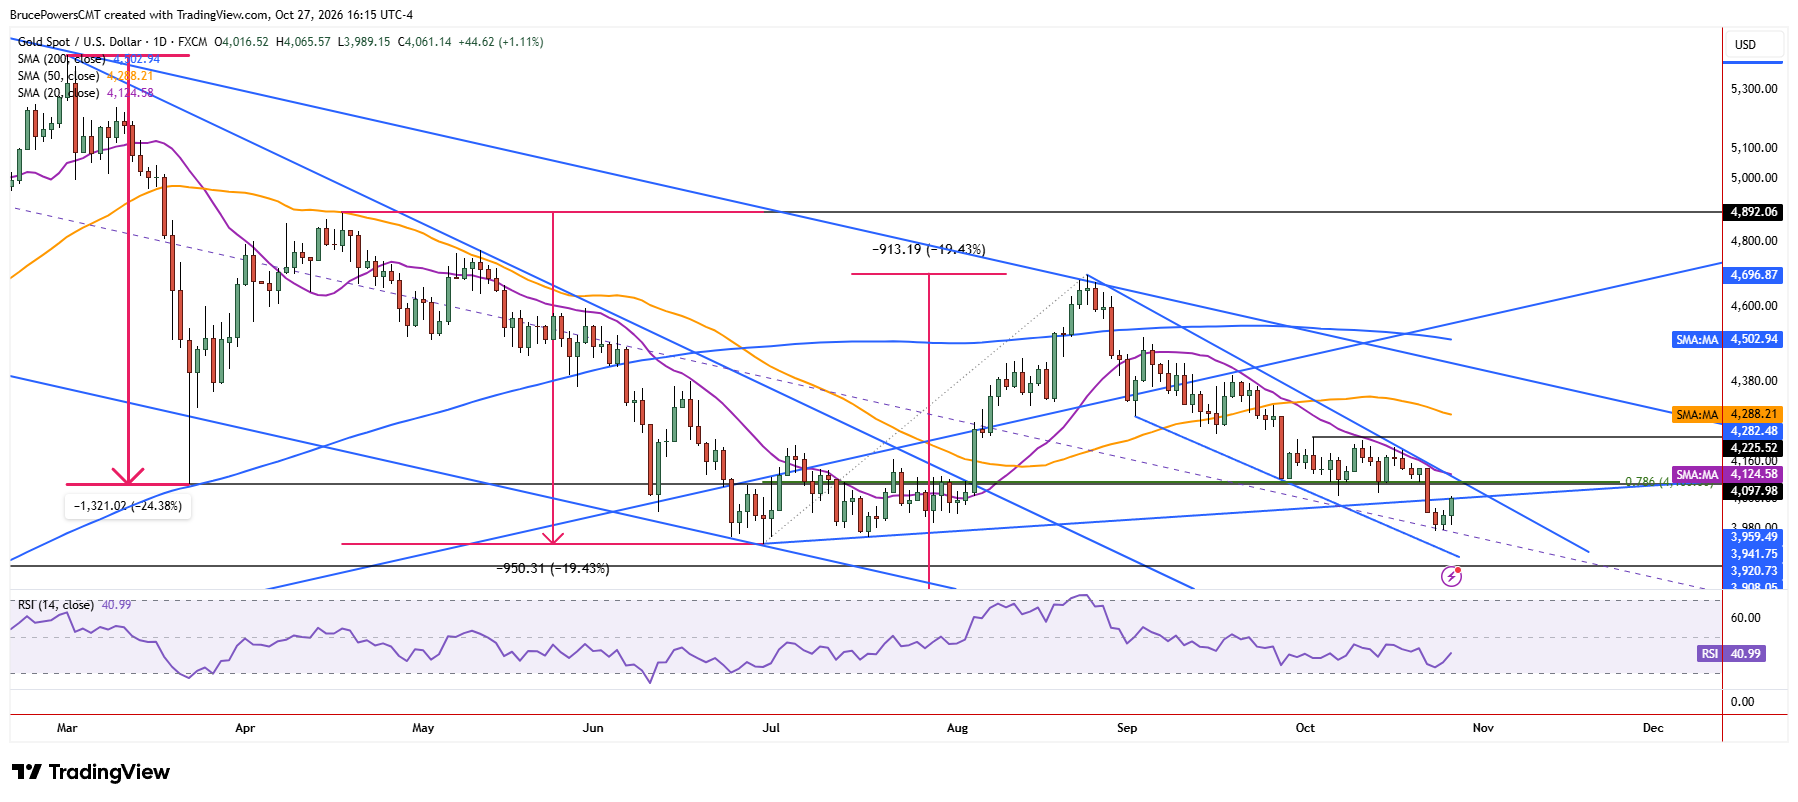
Gold triggered a counter-trend rally on Tuesday, advancing to a three-day high of $4,066 at the time of writing. This key near-term support at last week’s low of $3,975 following a test of support near the June low of $3,942. The larger bearish trend structure and recent signals suggest that the June low is at risk of failure, while short-term strength is likely to hit resistance and turn back down.
Resistance Levels Define Recovery Potential
Tuesday’s high tested resistance near a minor rising trendline that had previously acted as support. This reinforces the validity of the trendline and shows gold reacting to a key level, increasing the significance of a potential breakout above Tuesday’s high. More significant resistance is near $4,103, as it provided a support shelf prior to last week’s breakdown. Beyond that, there is the 20-day moving average near $4,124 and falling. This average is key dynamic resistance for the short-term decline that followed the August peak. A rise above it would show greater strength than seen during prior upswings after the long-term rising trendline was broken in early September.
Bullish Reversal Requires Stronger Confirmation
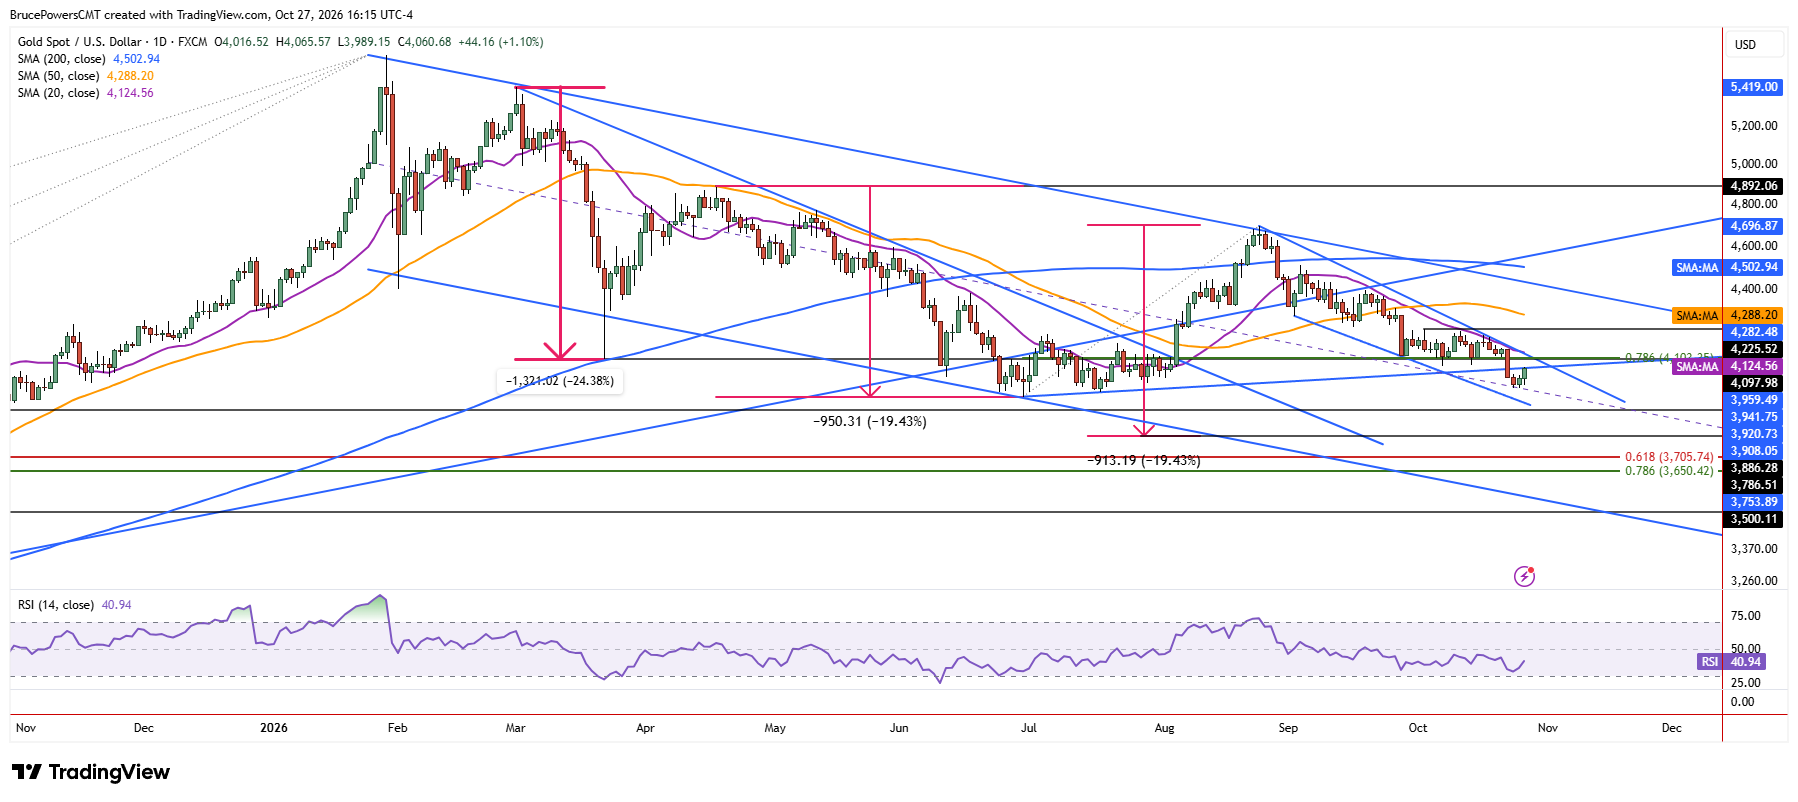
An alternative scenario, which would not begin to gain validity without a sustained reclaim of the 20-day moving average, is that last week’s low leads to a second bottom and higher swing low. That could be followed by a second leg up from the June bottom. Although a reclaim of the 20-day moving average would show improving demand, a bullish trend reversal signal would require an advance above the recent lower swing high of $4,226 on the daily chart.
Weekly Resistance Holds Key to Trend Change
There is also last week’s lower weekly high of $4,190. A recovery above that level would provide a bullish signal on that timeframe. Notably, the 20-week moving average is near $4,221 and was successfully tested as resistance during the minor advance two weeks ago. This reinforces the potential for continued resistance near the 20-week moving average and highlights the significance of a decisive move back above it. Until gold can reclaim these key resistance levels, the broader bearish structure remains in place, leaving the June low near $3,942 vulnerable to another test.
If you’d like to know more about how to trade gold and silver, please visit our educational area.