Gold Tests New Highs As Rally Continues
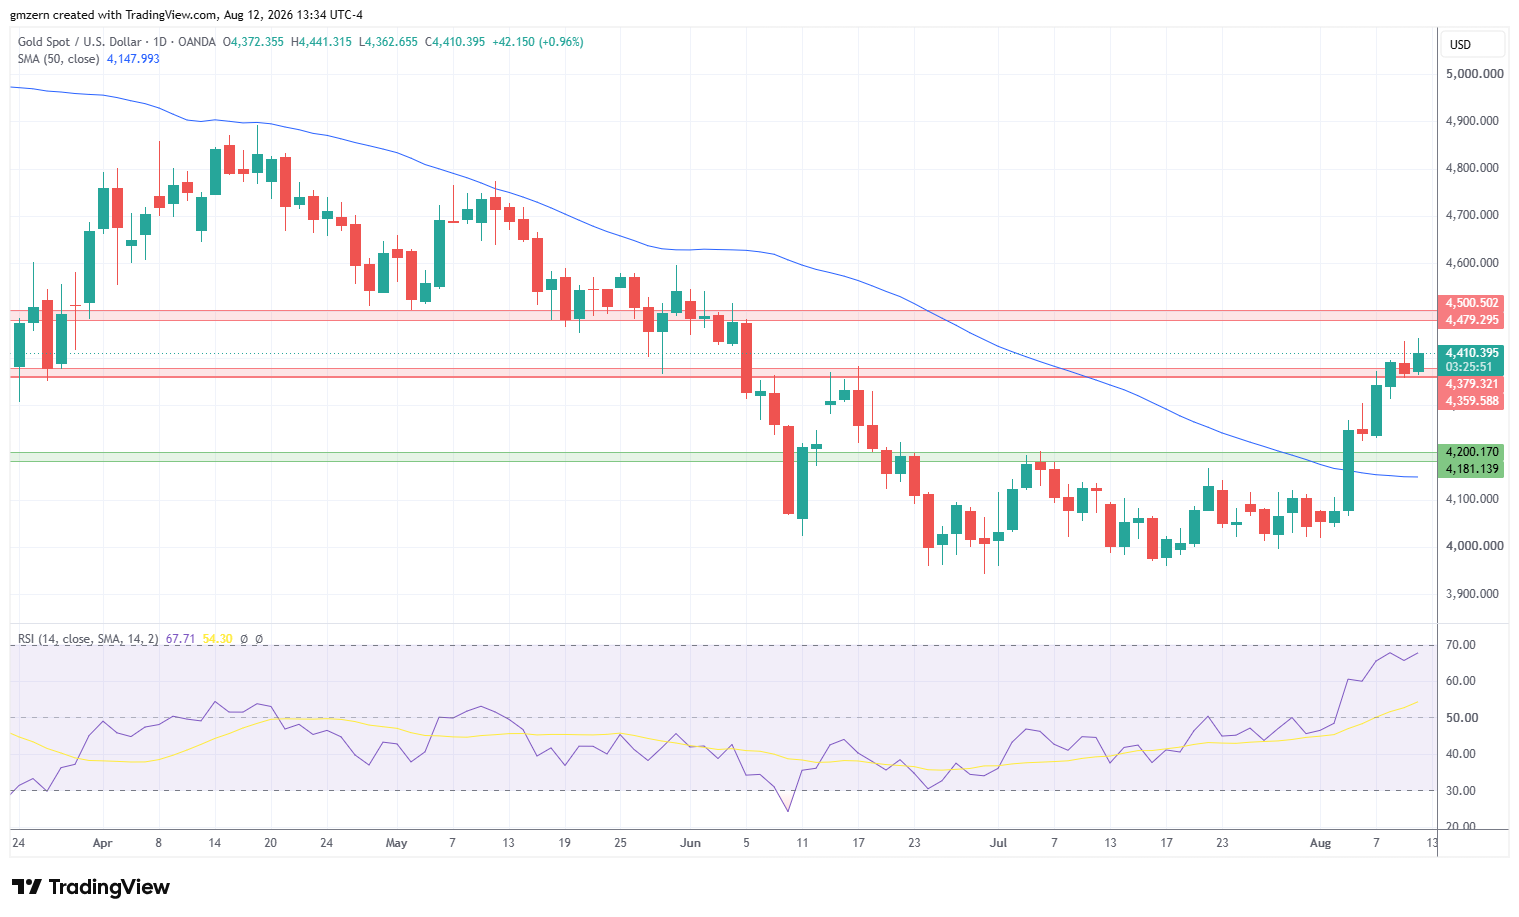
Gold tested two-month highs as traders focused on U.S. CPI report. The report indicated that Inflation Rate declined from 3.5% in June to 3.4% in July, in line with analyst estimates. Core Inflation Rate has also met analyst expectations.
Treasury yields moved lower as bond traders reacted to inflation data. The yield of 2-year Treasuries declined below the 4.19% level, while the yield of 10-year Treasuries settled near 4.67%. Falling Treasury yields are bullish for gold that pays no interest.
FedWatch Tool indicates that there is a 61.9% probability that Fed will leave rates unchanged at the next meeting in September. The market continues to expect that Fed will start the rate hike cycle this year, making the first 25 bps hike in December. The recent decline in rate hike probability serves as a positive catalyst for gold.
U.S. dollar gained ground against a broad basket of currencies despite falling Treasuries yields. Dollar’s move put some pressure on gold markets and pushed them away from two-month highs.
Gold moved above the resistance at $4360 – $4380 and climbed above the $4400 level. In case gold settles above $4400, it will head towards the resistance, which is located in the $4480 – $4500 range.
On the support side, a move below the $4360 level will push gold towards the $4300 level. If gold declines below $4300, it will head towards the support level at $4180 – $4200.

Silver Tests The $66.00 Level As Gold/Silver Ratio Pulls Back
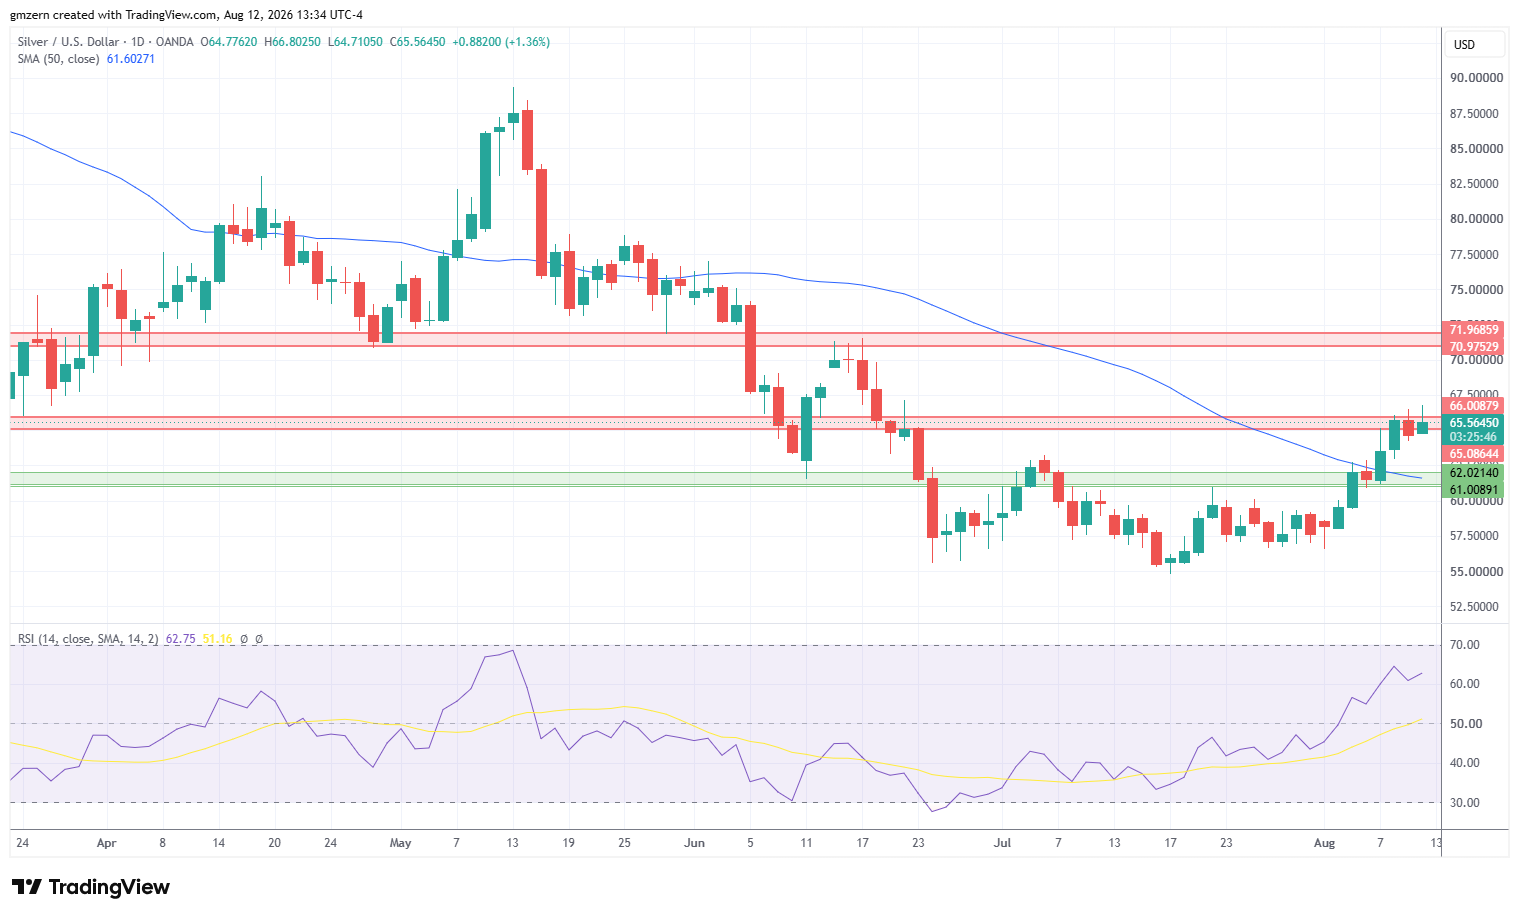
Silver gained ground as gold/silver ratio pulled back below the 67.50 level. In case gold/silver ratio settles below the 50 MA at $67.51, it will head towards the 66.00 level, which will be bullish for silver.
From the technical point of view, silver continues its attempts to settle above the resistance level at $65.00 – $66.00. This resistance level has been tested several times and proved its strength. If silver climbs above the $66.00 level, it will head towards the next resistance at $71.00 – $72.00.
On the support side, silver needs to settle back below the $64.00 level to have a chance to gain downside momentum in the near term. In this case, silver will head towards the support level at $61.00 – $62.00. A move below the $61.00 level will push silver towards the $57.00 level.
Gold Price Forecast
Every new Gold analysis as it publishes, today's technical signal and key levels, live price — on one page.
See all Gold forecastsPlatinum Attempts To Settle Above $1800
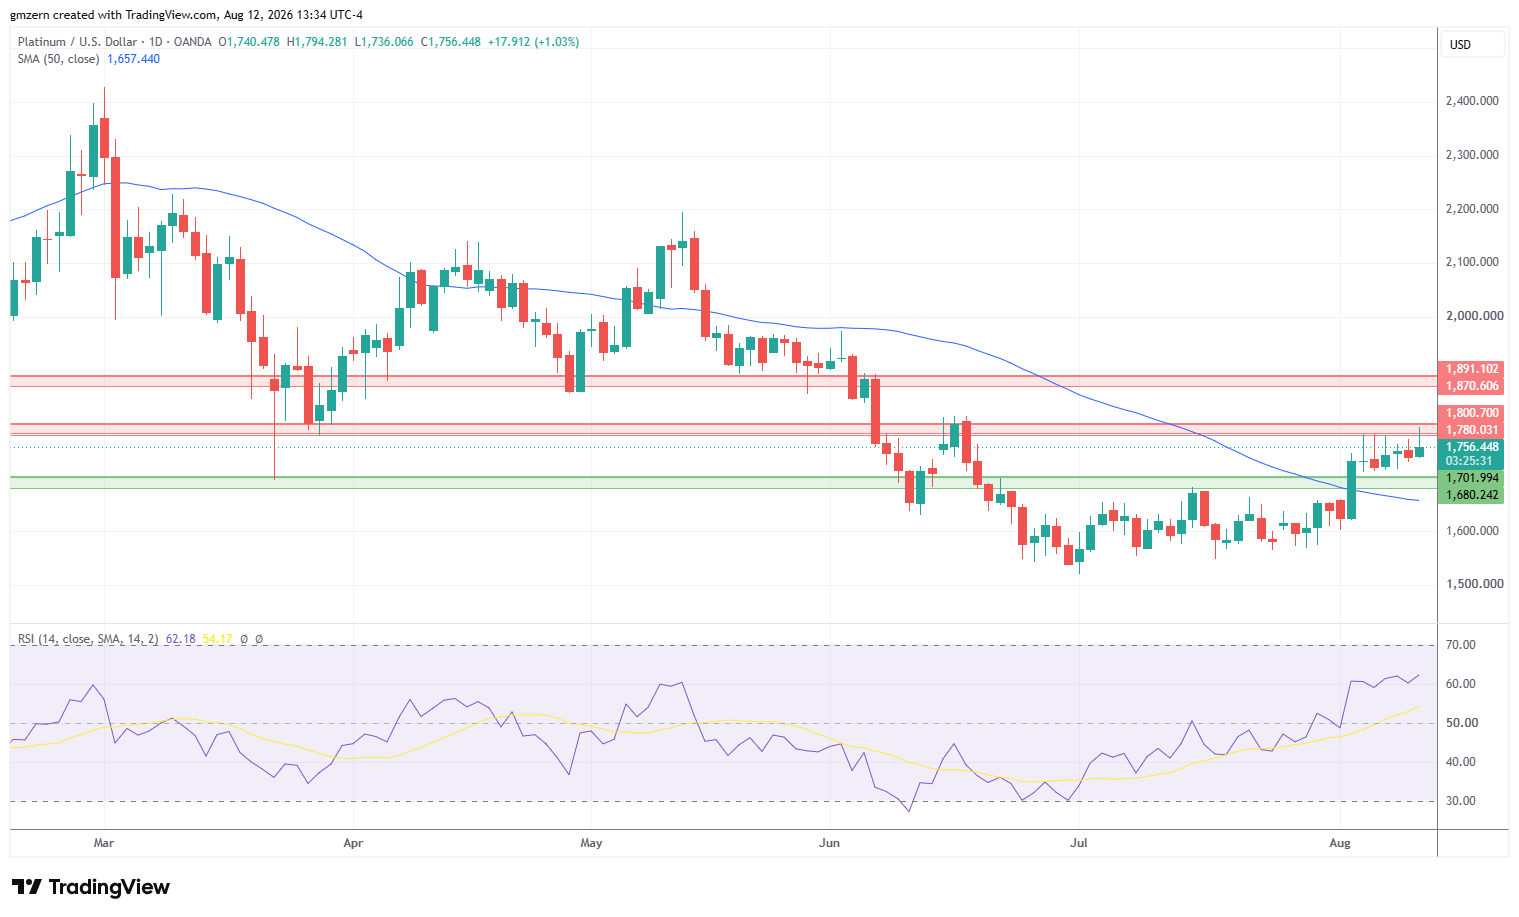
Platinum made an attempt to settle above the resistance at $1780 – $1800 but lost momentum and pulled back. Palladium markets were up by +0.4%, which was neutral for platinum. Oil prices were mostly flat in choppy trading. The dynamics of oil markets did not have a material impact on platinum prices in today’s trading session.
In case platinum manages to settle above the resistance level at $1780 – $1800, it will move towards the next resistance, which is located in the $1870 – $1890 range. RSI is in the moderate territory, so there is plenty of room to gain additional upside momentum in case the right catalysts emerge.
On the support side, a successful test of the support at $1680 – $1700 will push platinum towards the 50 MA at $1657. If platinum declines below the 50 MA, it will head towards the $1600 level.
If you’d like to know more about how to trade gold and silver, please visit our educational area.