


Gold is under pressure from two sides this Thursday. Oil is keeping inflation fears, and with them Fed tightening, in play, while one of the world’s biggest official holders is selling reserves.
Gold: Oil Keeps the Fed Hawkish
Gold slipped for a fourth straight session on Wednesday as higher oil prices fed inflation concerns. That keeps the Fed on its tightening path. Nearly all economists in a Reuters poll expect the Fed to hold rates this month and hike in December, as policymakers prefer patience while price pressures stay stubborn. Because gold pays no yield, that December hike is the main reason rallies keep fading. The next tests are the Fed’s October 27-28 meeting and next week’s PCE data, the central bank’s preferred inflation gauge.
Official Sector: Russia Sells, Others Buy
The pressure is not only coming from rates. Russia sold 200,000 ounces of gold, about 6.2 tonnes, in September, according to central bank data, cutting its reserves to 2,264 tonnes, the lowest since the end of 2019. It has sold about 62 tonnes since December, its largest sustained drawdown since 1998, as the government uses reserves to cover a widening budget deficit. Official buying elsewhere has not stopped, though. China made its largest monthly purchase in three years in September, so Russia’s sales offset only part of that demand.
Investor demand has held up too. World Gold Council data show global gold ETF holdings reached a record 4,278 tonnes last week. Even so, record holdings have not been enough to stop a four-day slide, which tells me the rate story still has the upper hand.
Silver: Same Rate Headwind, Fewer Buffers
Silver faces the same Fed headwind as gold, but without central bank buying to cushion it. That leaves the metal more exposed to shifts in rate expectations and industrial sentiment ahead of next week’s meeting.
Gold Price Forecast
Every new Gold analysis as it publishes, today's technical signal and key levels, live price — on one page.
See all Gold forecastsGold Technical Analysis: XAU/USD Slides Toward $4,079 as Sellers Take Control
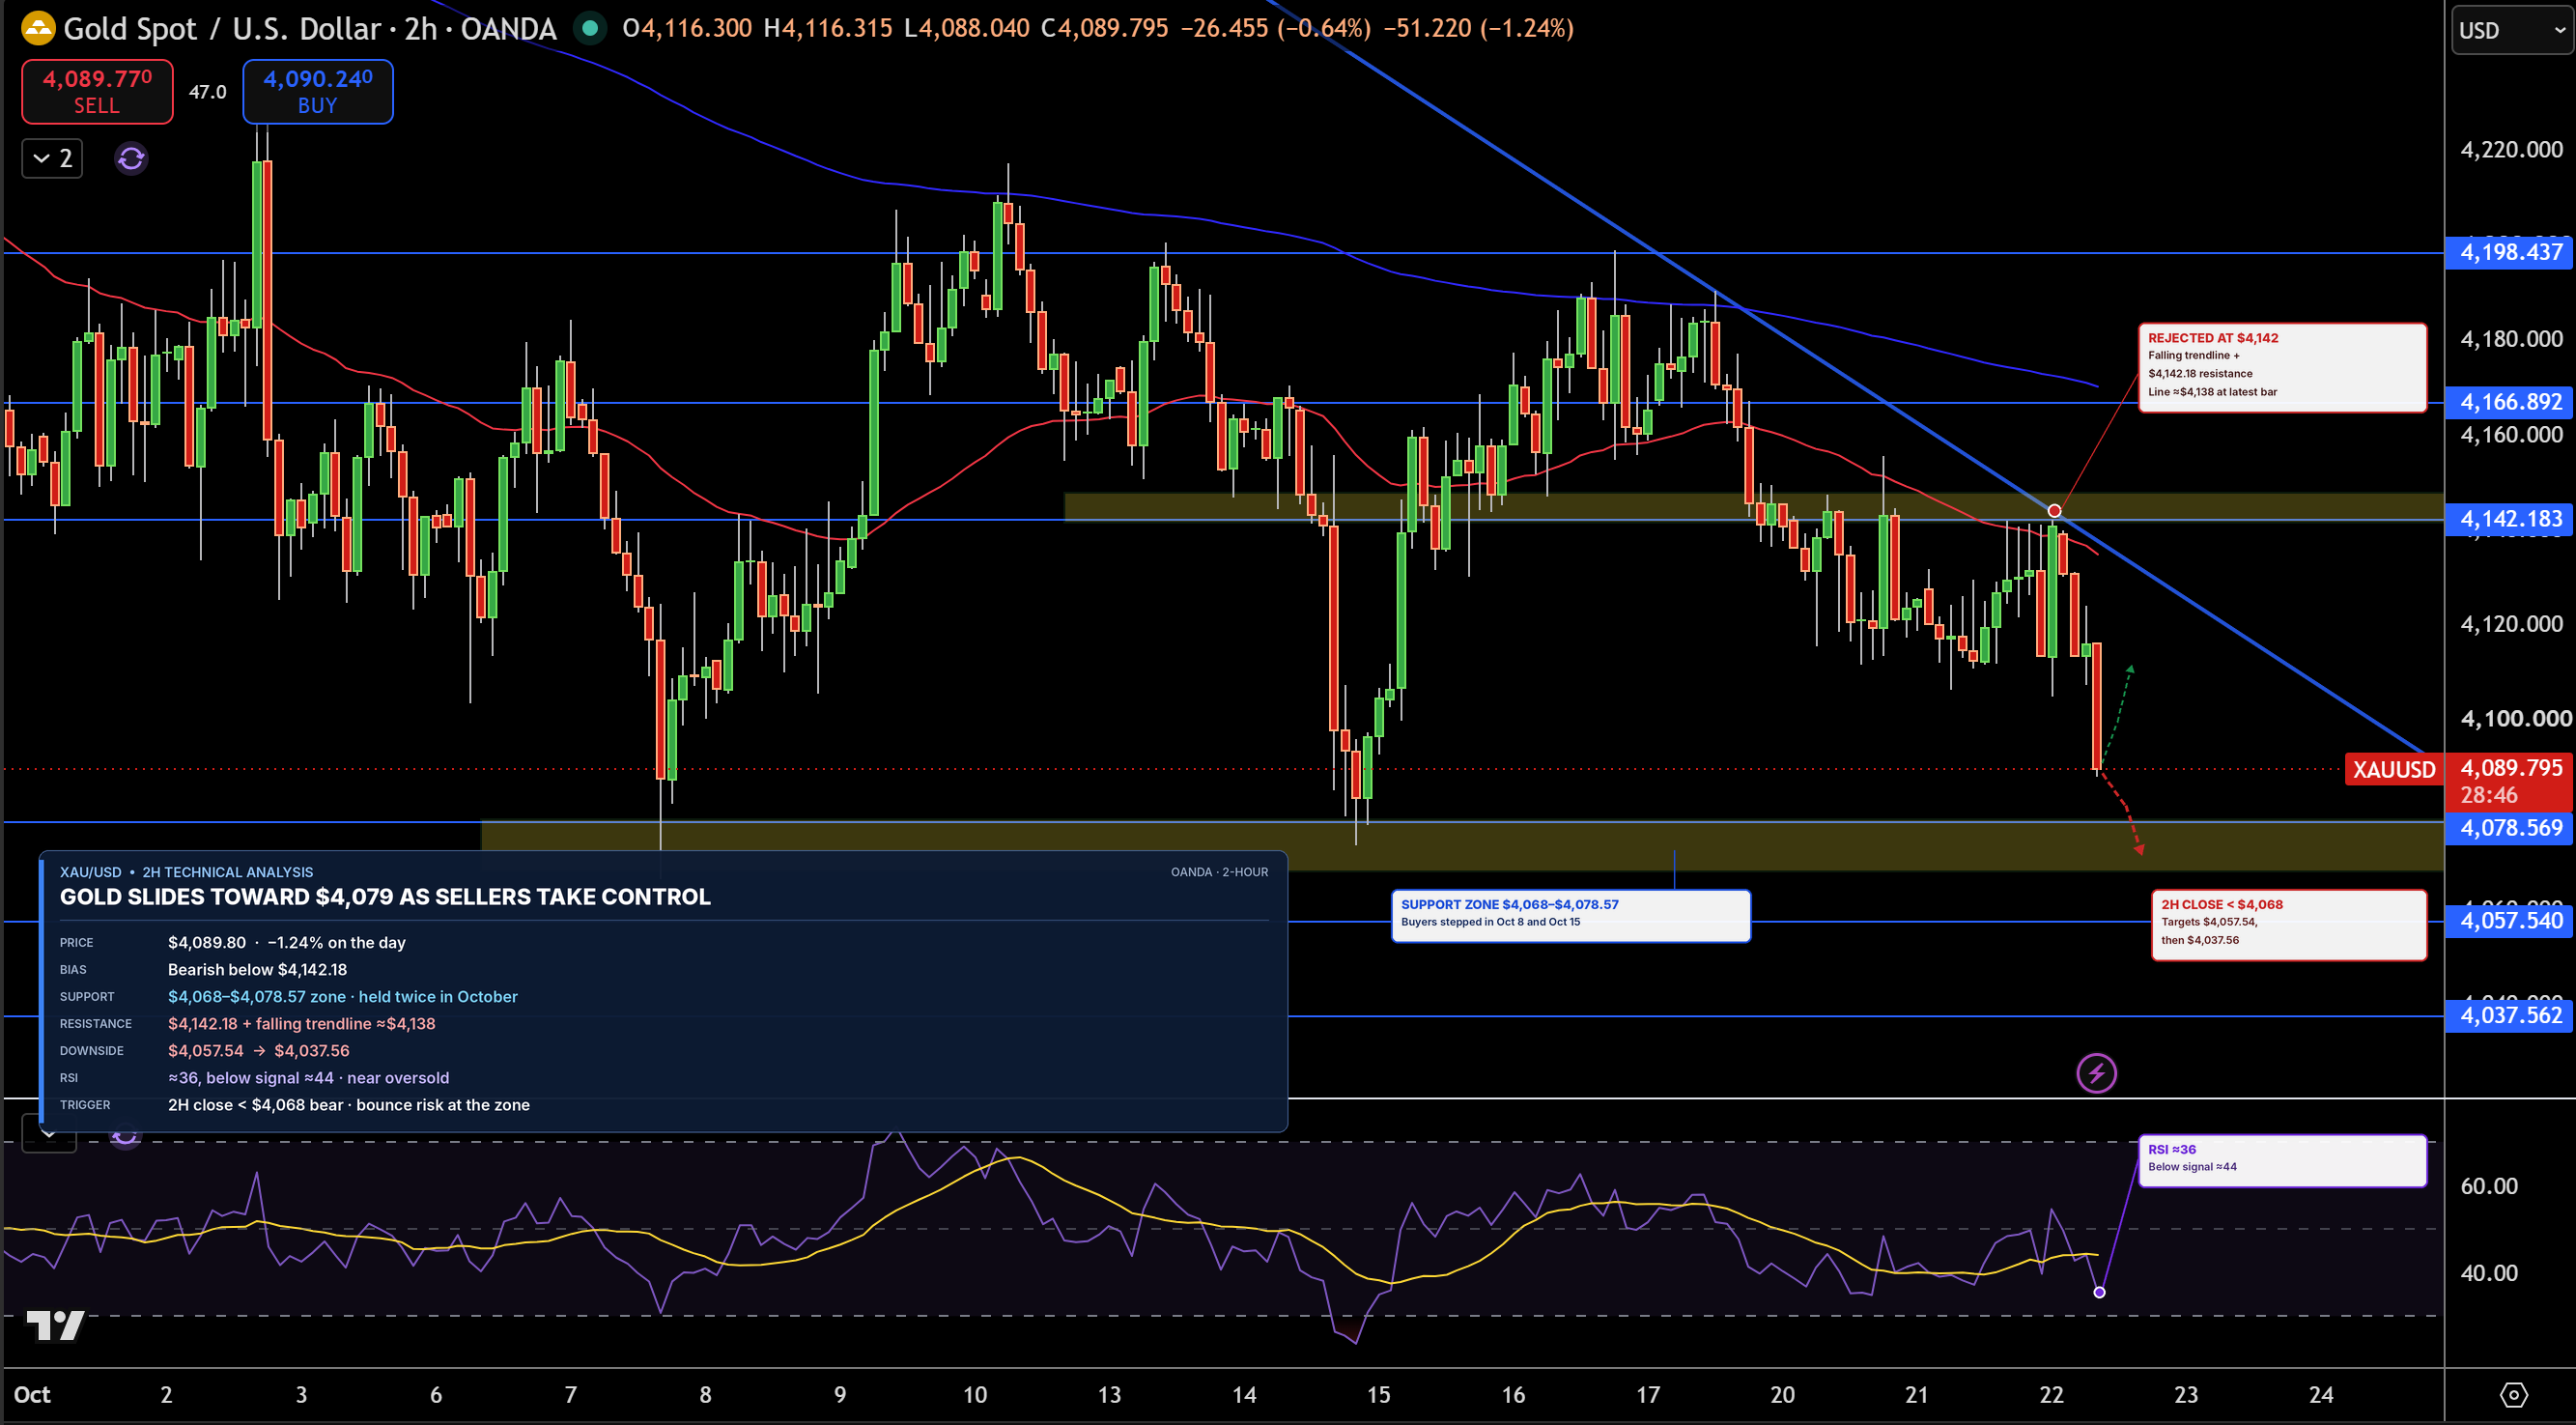
Gold is trading near $4,090 on the 2-hour chart after another rejection at the falling trendline near $4,142. That rejection triggered a sharp drop, and price is now below both moving averages, so sellers are in charge for now.
The $4,068 to $4,079 zone is the key support, since buyers stepped in there twice this month. If that floor breaks, the way opens for $4,058 and then $4,038. On the upside, gold needs to clear $4,142 before the pressure eases.
RSI is near 36 and below its signal line, so selling pressure is strong and getting close to oversold. A bounce from $4,079 is possible, but I lean bearish while gold stays below $4,142, and a close below $4,068 would open more downside.
Silver Technical Analysis: XAG/USD Breaks Triangle Support as $55.41 Comes Into Focus
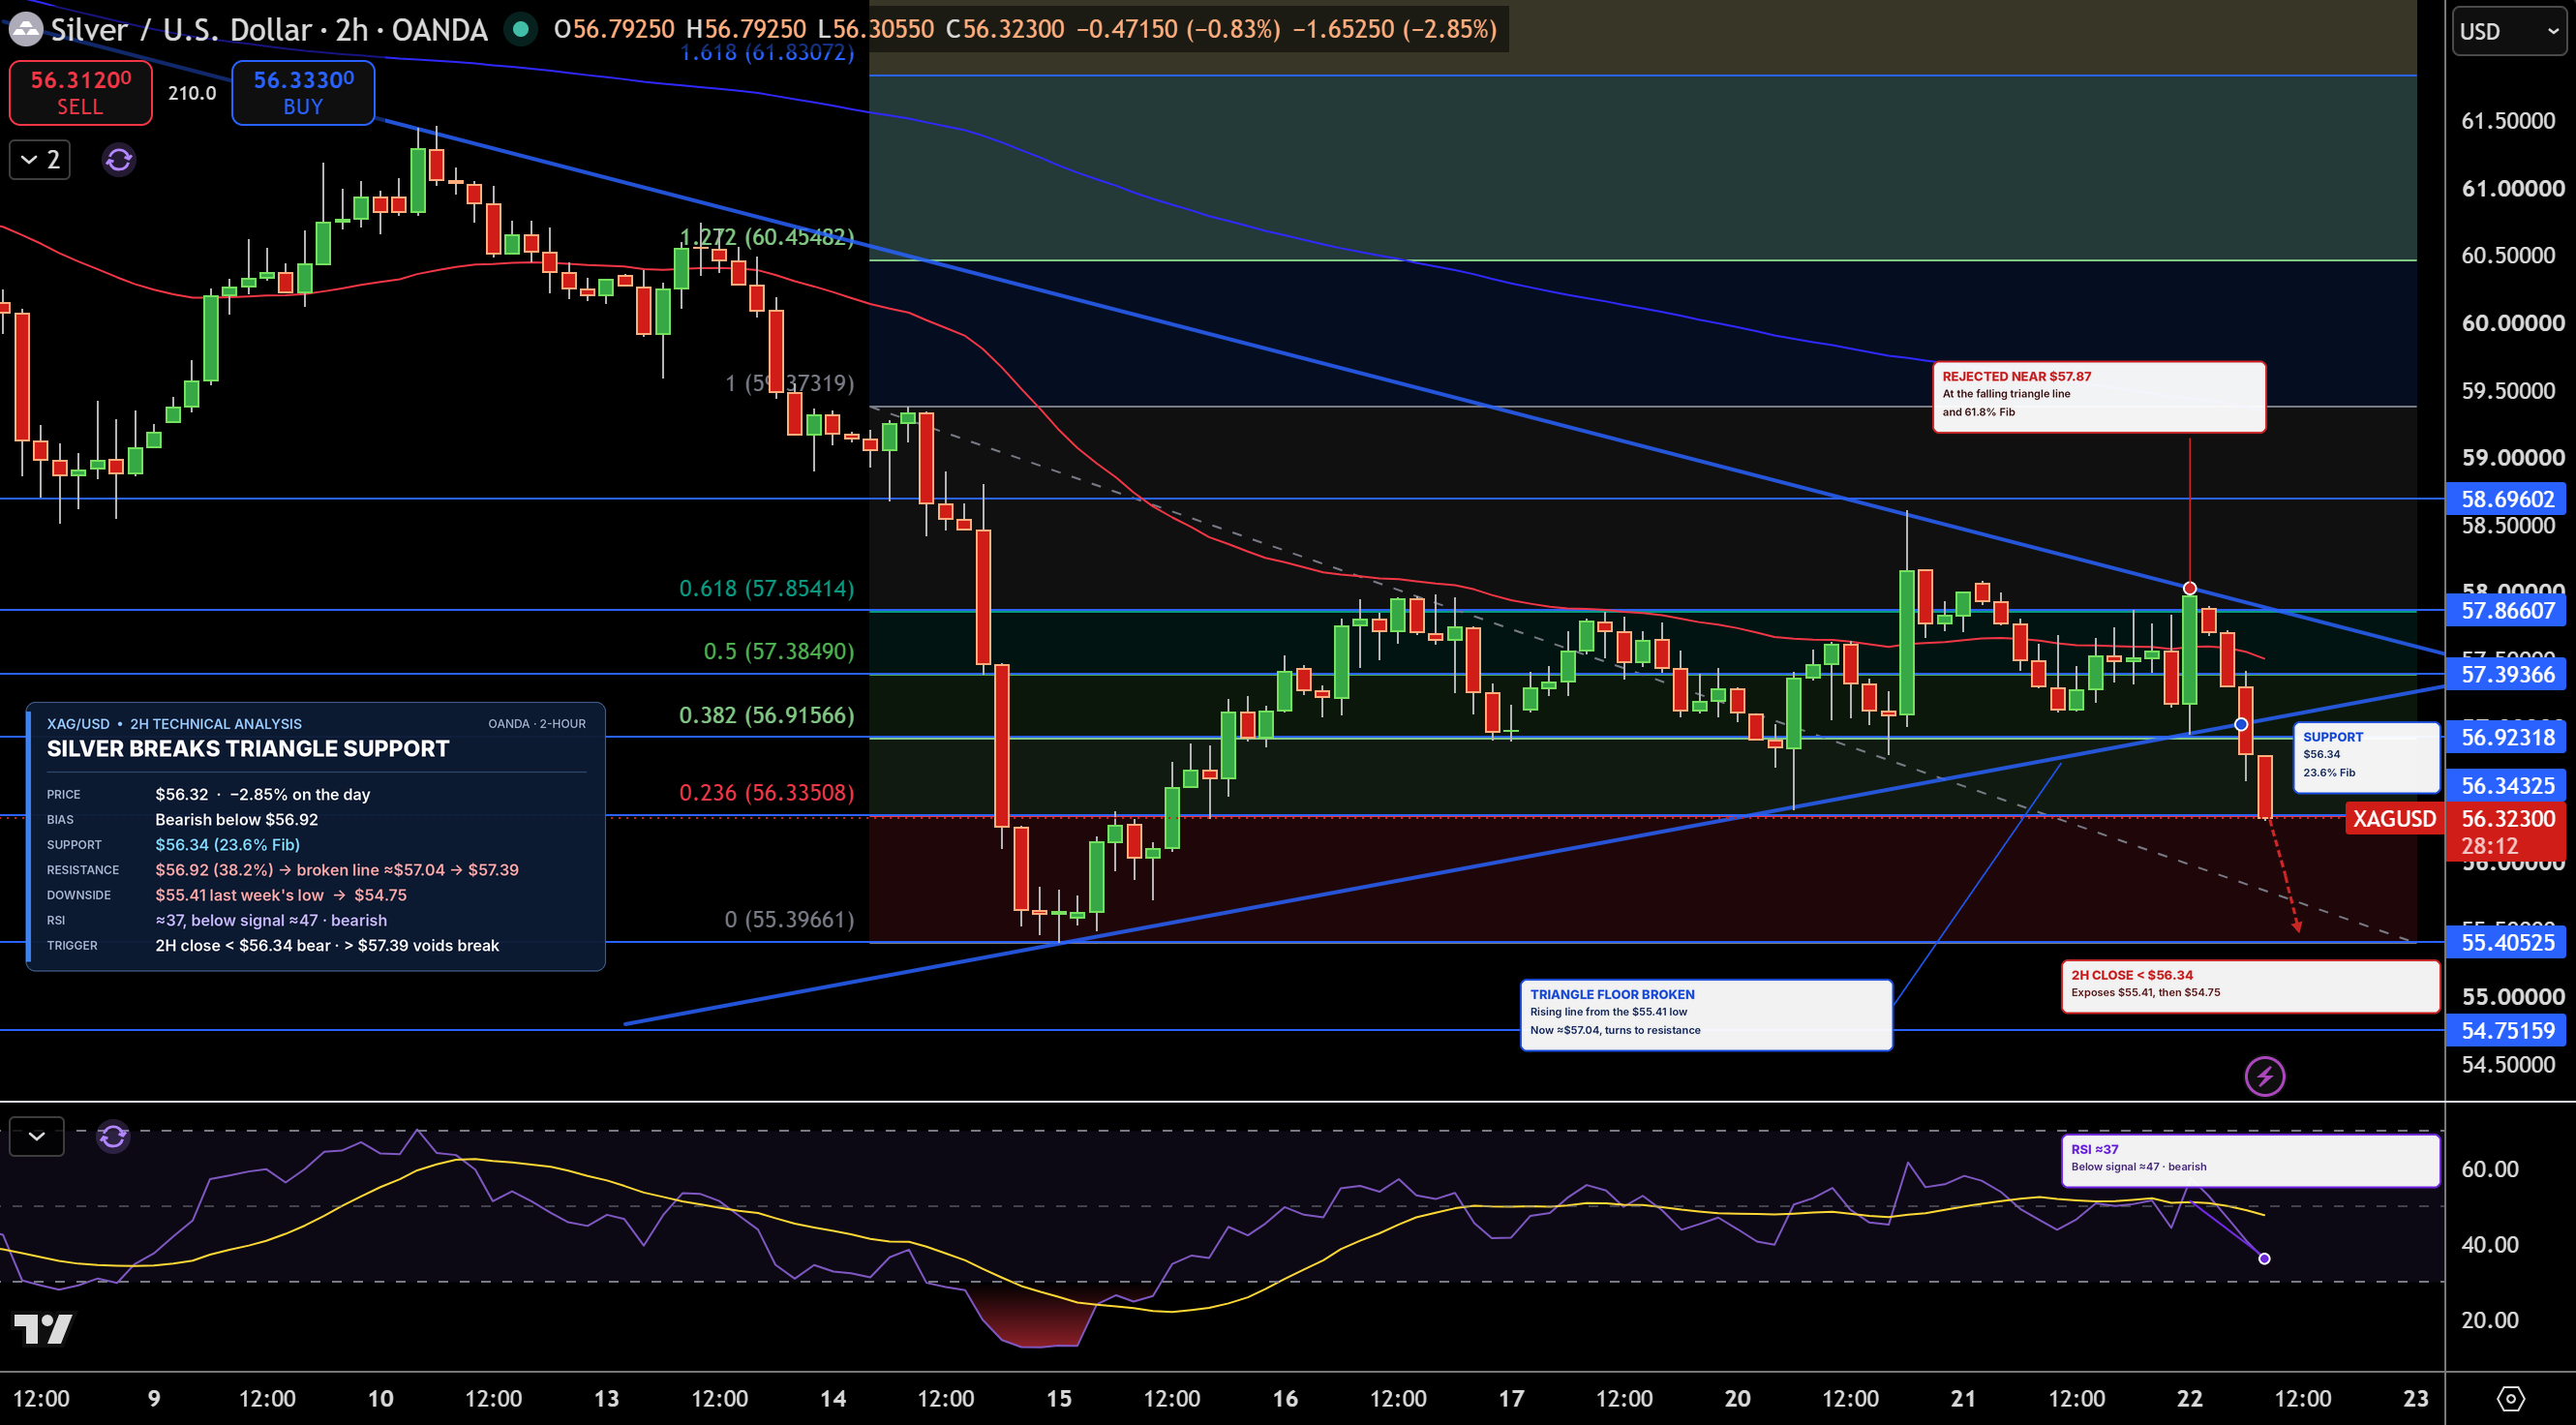
Silver is trading near $56.32 on the 2-hour chart after breaking below the rising trendline of its triangle. The break came right after another rejection near $57.87. A triangle break usually sets the direction for the next leg, and here it points lower. Price has also fallen below the 38.2% Fibonacci level at $56.92 and is now testing $56.34.
If $56.34 gives way, the next target is $55.41, last week’s low, followed by $54.75. On the upside, $56.92 is now resistance, with $57.39 above it.
RSI is near 37 and below its signal line, so momentum has turned bearish. I would stay bearish below $56.92. A close below $56.34 would strengthen that view, while only a move back above $57.39 would cancel the breakdown.