


Gold Steadies as Softer Oil Eases Rate Fears Before the Fed
Gold and silver found some footing on Monday after a punishing week. The Federal Reserve decides on rates this week, and the main question is whether last week’s energy-driven sell-off has run its course.
Gold: Oil Sets the Tone
Spot gold rose 0.4% to $4,009.87 an ounce early Monday as oil prices softened, Reuters reported, with the Fed’s October 27-28 meeting in focus. Oil matters here because it drove last week’s drop. Gold fell about 4% last week, its steepest weekly decline in more than four months, as rising oil fueled inflation worries. Higher inflation makes a Fed rate hike more likely, and higher rates hurt gold because it pays no interest.
Last week also showed a weak spot in investor demand. Jim Wyckoff, market analyst at American Gold Exchange, told Reuters that the sell-off in tech stocks led to margin calls, meaning brokers asked investors to put up more cash to cover losses on borrowed positions, prompting them to sell gold and silver. The safe-haven buying went to bonds instead, with US Treasuries rallying as investors moved out of AI-related stocks.
The Fed is widely expected to hold rates this week, but CME’s FedWatch tool, which turns futures prices into rate odds, shows about a 75% chance of at least one hike by December. That leaves Chair Kevin Warsh’s message on Wednesday and Thursday’s PCE inflation data, the Fed’s preferred inflation gauge, as the next tests for gold.
Silver: The Weaker Link
Silver fell harder than gold last week and hit its lowest level since November 2025. It rose 0.6% to $54.19 on Monday, but that is a small bounce after a steep slide. Because silver is both an investment metal and an industrial metal used in factories, the selling tied to stock losses added to worries about industrial demand. That leaves it exposed to tighter Fed policy and to growth fears from the energy shock at the same time.
Gold Price Forecast
Every new Gold analysis as it publishes, today's technical signal and key levels, live price — on one page.
See all Gold forecastsWhat Comes Next
Softer oil gives both metals some short-term relief. But as long as energy keeps inflation high and the Fed keeps a December hike on the table, gold and silver face a steady rate headwind.
Gold Technical Analysis: XAU/USD Stalls Below $4,032 as $3,946 Support Comes Into Focus
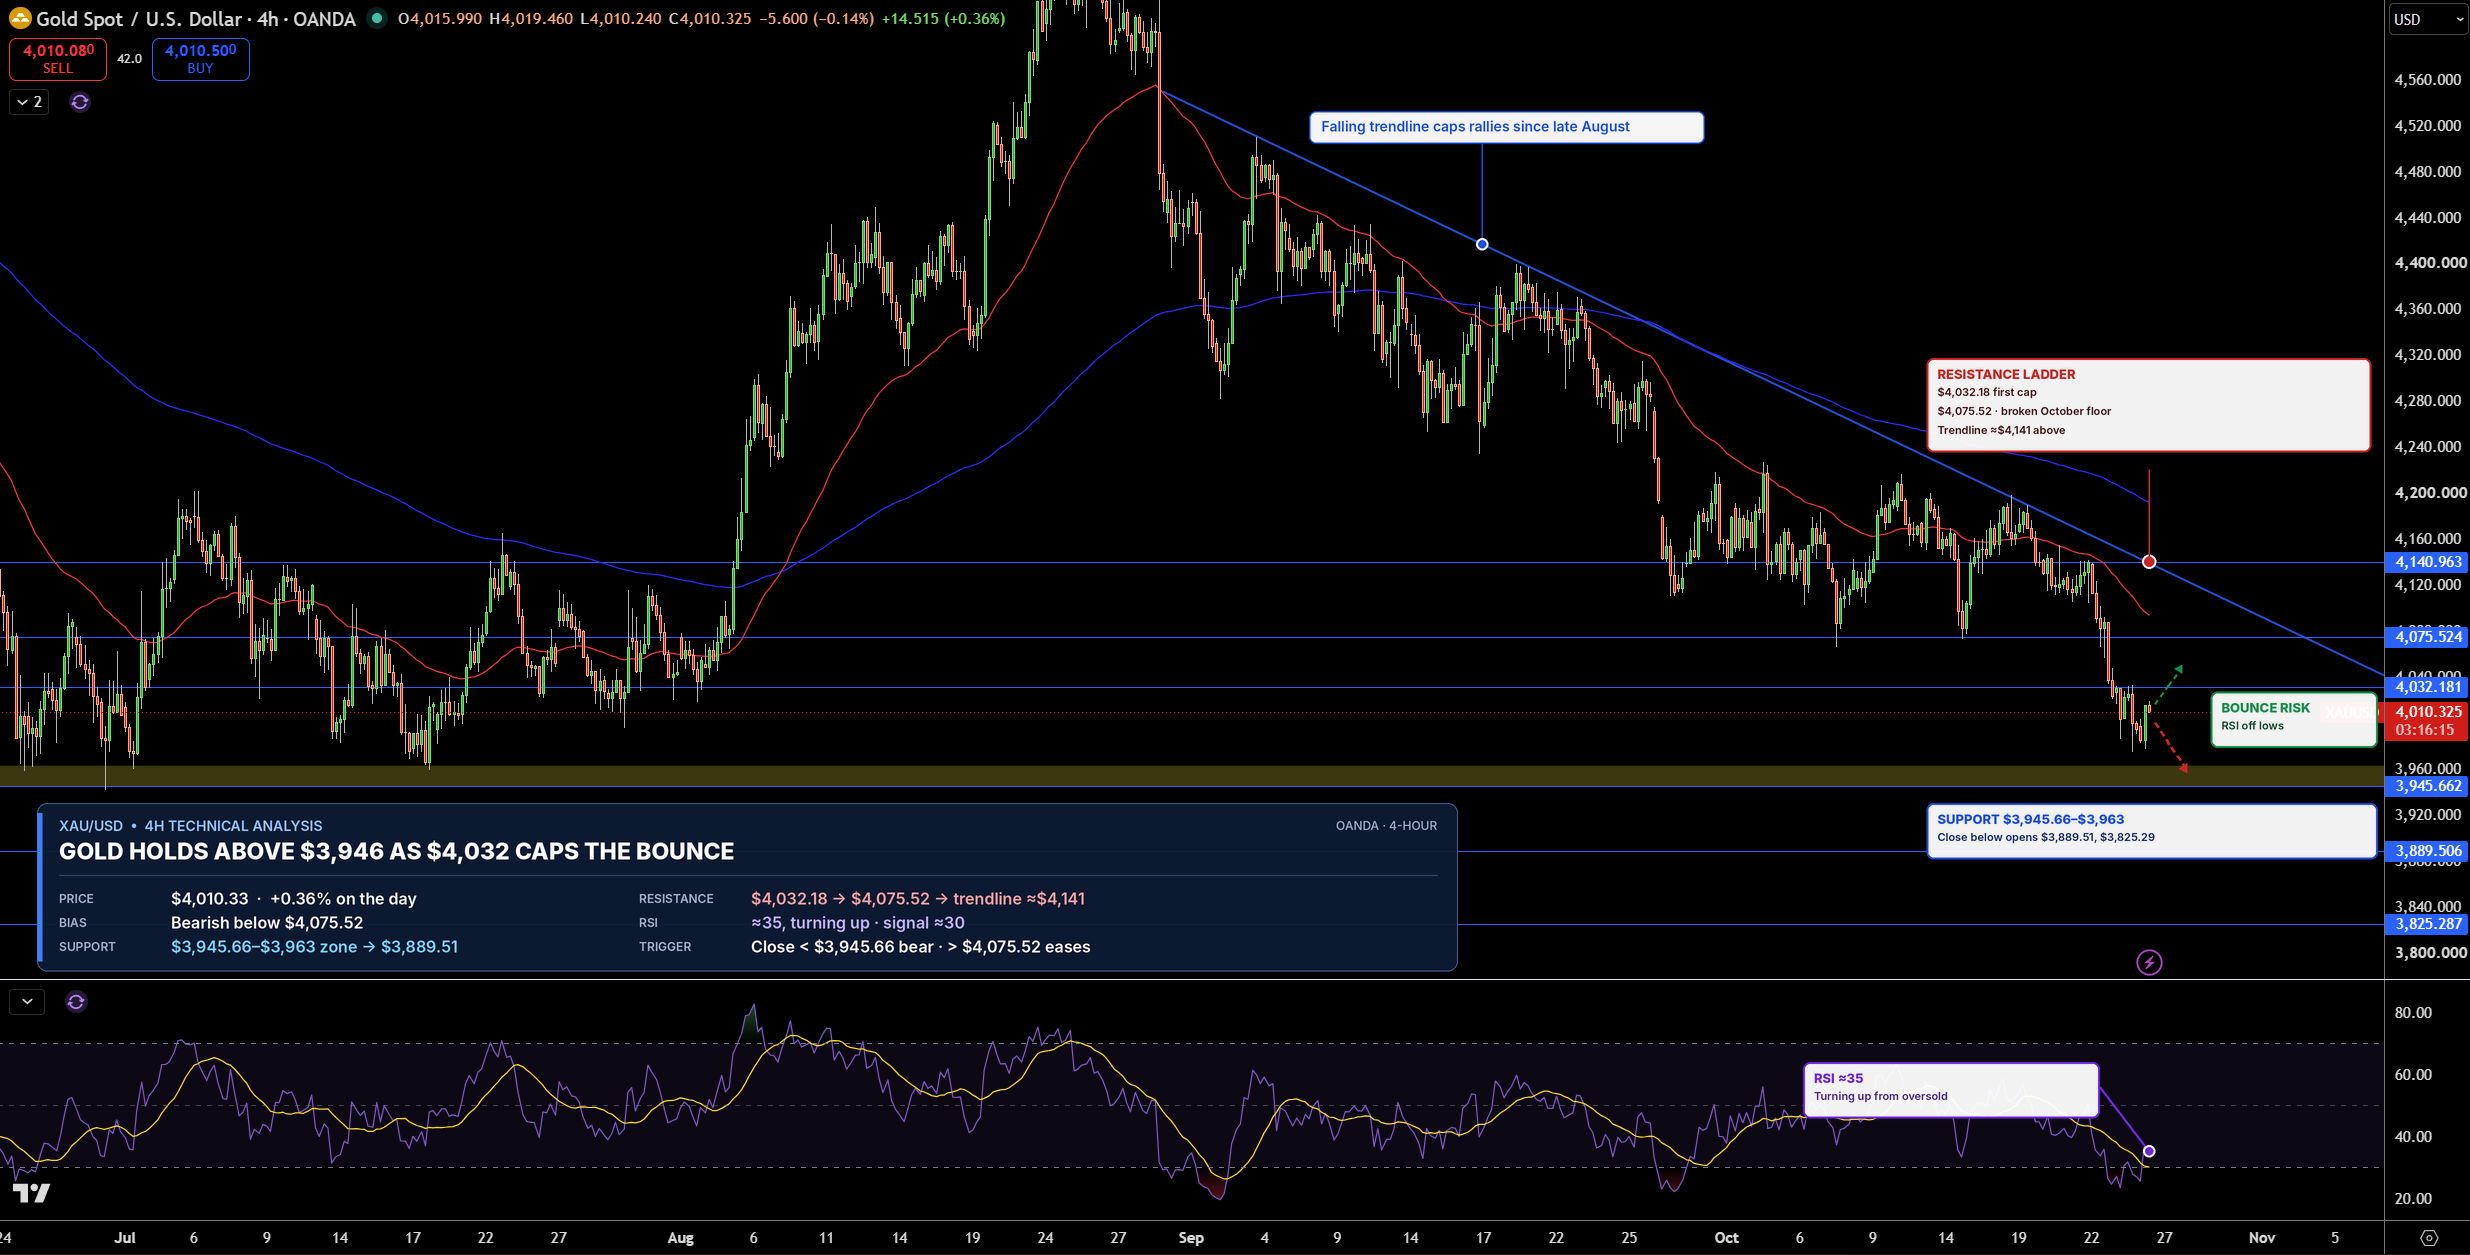
Gold is trading near $4,010 on the 4-hour chart. It remains below a falling trendline, a line connecting lower highs, which has capped every rally since late August. Gold is also below both moving averages, lines that show the average price over time.
The first resistance, where sellers tend to step in, is $4,032, then $4,075. Support, where buyers tend to step in, is the $3,946 to $3,963 zone, then $3,890.
RSI, which measures the strength of recent buying and selling, is near 35 and turning up from oversold, meaning prices fell too fast, so a short bounce is possible. I stay bearish while gold is below $4,075. A close below $3,946 would open the way to $3,890.
Silver Technical Analysis: XAG/USD Stalls Near $54 Inside Falling Channel
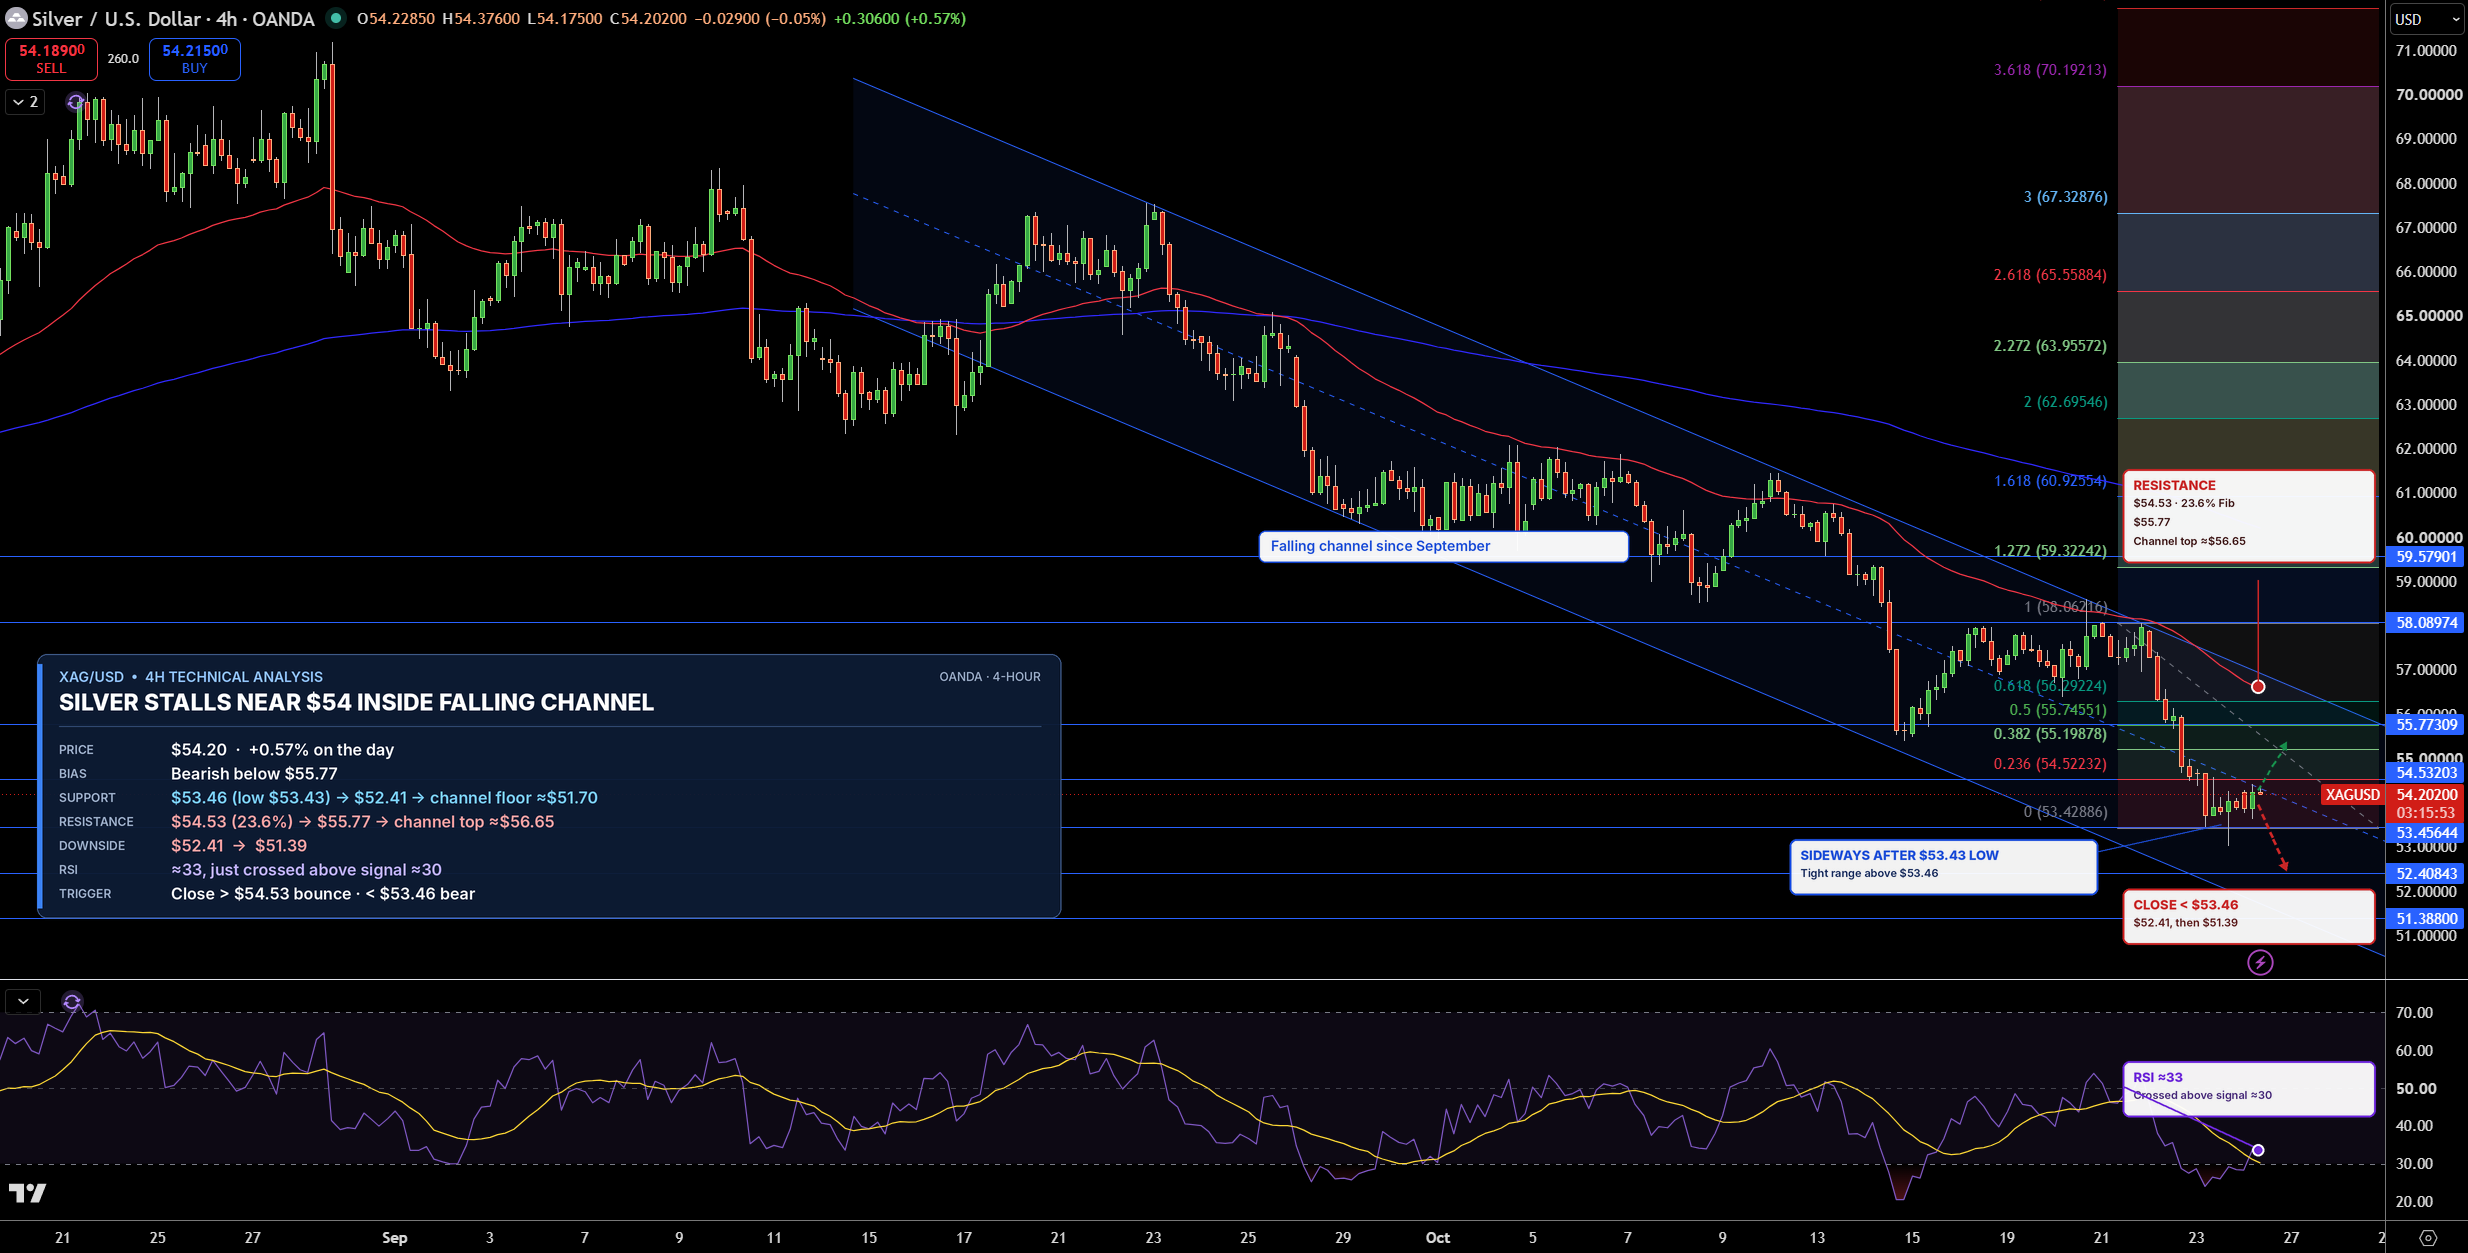
Silver is trading near $54.20 on the 4-hour chart, still inside a falling channel, two parallel lines that have guided prices lower since September. After hitting $53.43, it is moving sideways in a tight range.
Resistance comes in at $54.53, then $55.77. Support sits at $53.46, then $52.41.
RSI is near 33 and has just crossed above its signal line, a slower average of RSI, which shows selling is easing. In my view, the bias stays bearish below $55.77. A close above $54.53 could bring a short bounce, while a drop below $53.46 would point to $52.41.