



Dollar Loses Rate Support as AI Rout Sends Investors Into Treasuries
The dollar lost some of its interest rate advantage after a sell-off in tech stocks on Thursday sent investors rushing into US government bonds. In Europe, France’s borrowing costs climbed to their highest since 2002, while sterling is still leaning on an expected Bank of England rate hike.
Dollar Index: Hike Bets Pared Back
Worries about how much money AI companies need to raise hit tech stocks and triggered the biggest one-day rally in Treasuries in more than three years, Reuters reported. The 10-year yield fell more than 19 basis points, or 0.19 percentage point, its steepest drop since March 2023. Yields fall when bond prices rise, so this was a rush to buy US government debt.
Markets also stripped almost a full quarter-point rate hike out of next year’s Fed pricing, on worries that a bursting AI bubble could derail the data center boom. Fewer expected hikes make holding dollars less rewarding, and that takes away part of the rate edge that has kept traders long the dollar. The yen and Swiss franc, the currencies investors usually buy in a scare, gained. The Fed is still expected to keep rates on hold at its October 27-28 meeting.
Euro: France’s Premium Hits a 15-Year High
Softer US rate bets should have helped the euro, yet it has stayed flat around 1.12 because France is now the bigger worry. The premium investors demand to hold French 10-year bonds over German Bunds, meaning the extra interest France pays compared with Germany, the euro zone’s benchmark borrower, widened to a 15-year high on Thursday. That is the widest since November 2011, during the euro zone debt crisis, Reuters reported. France’s 10-year yield reached its highest level since July 2002, and the gap also widened for Belgium, Italy, Spain and Greece.
There is no easy rescue either. France is under an EU excessive deficit procedure, a formal EU process for countries whose budget deficit is too large, so it may not qualify for the ECB’s Transmission Protection Instrument, the central bank’s emergency tool for calming bond markets. ECB President Christine Lagarde has said the fix for France’s finances must be homegrown, which leaves the euro carrying that risk on its own.
EUR/USD Price Forecast
Every new EUR/USD analysis as it publishes, today's technical signal and key levels, live price — on one page.
See all EUR/USD forecastsPound: The Hike Case Holds Firm
Sterling’s support comes from home. September inflation rose to 3.5%, and core inflation, which leaves out food, energy, alcohol and tobacco, rose to 2.8%. As a result, LSEG data show traders treating a quarter-point Bank of England hike to 4% on November 5 as almost certain. UK rate expectations are rising while US expectations are being trimmed, and that gap is what GBP/USD is trading on.
US Dollar Index Technical Analysis: DXY Holds 101.50 as 101.85 Caps the Rebound
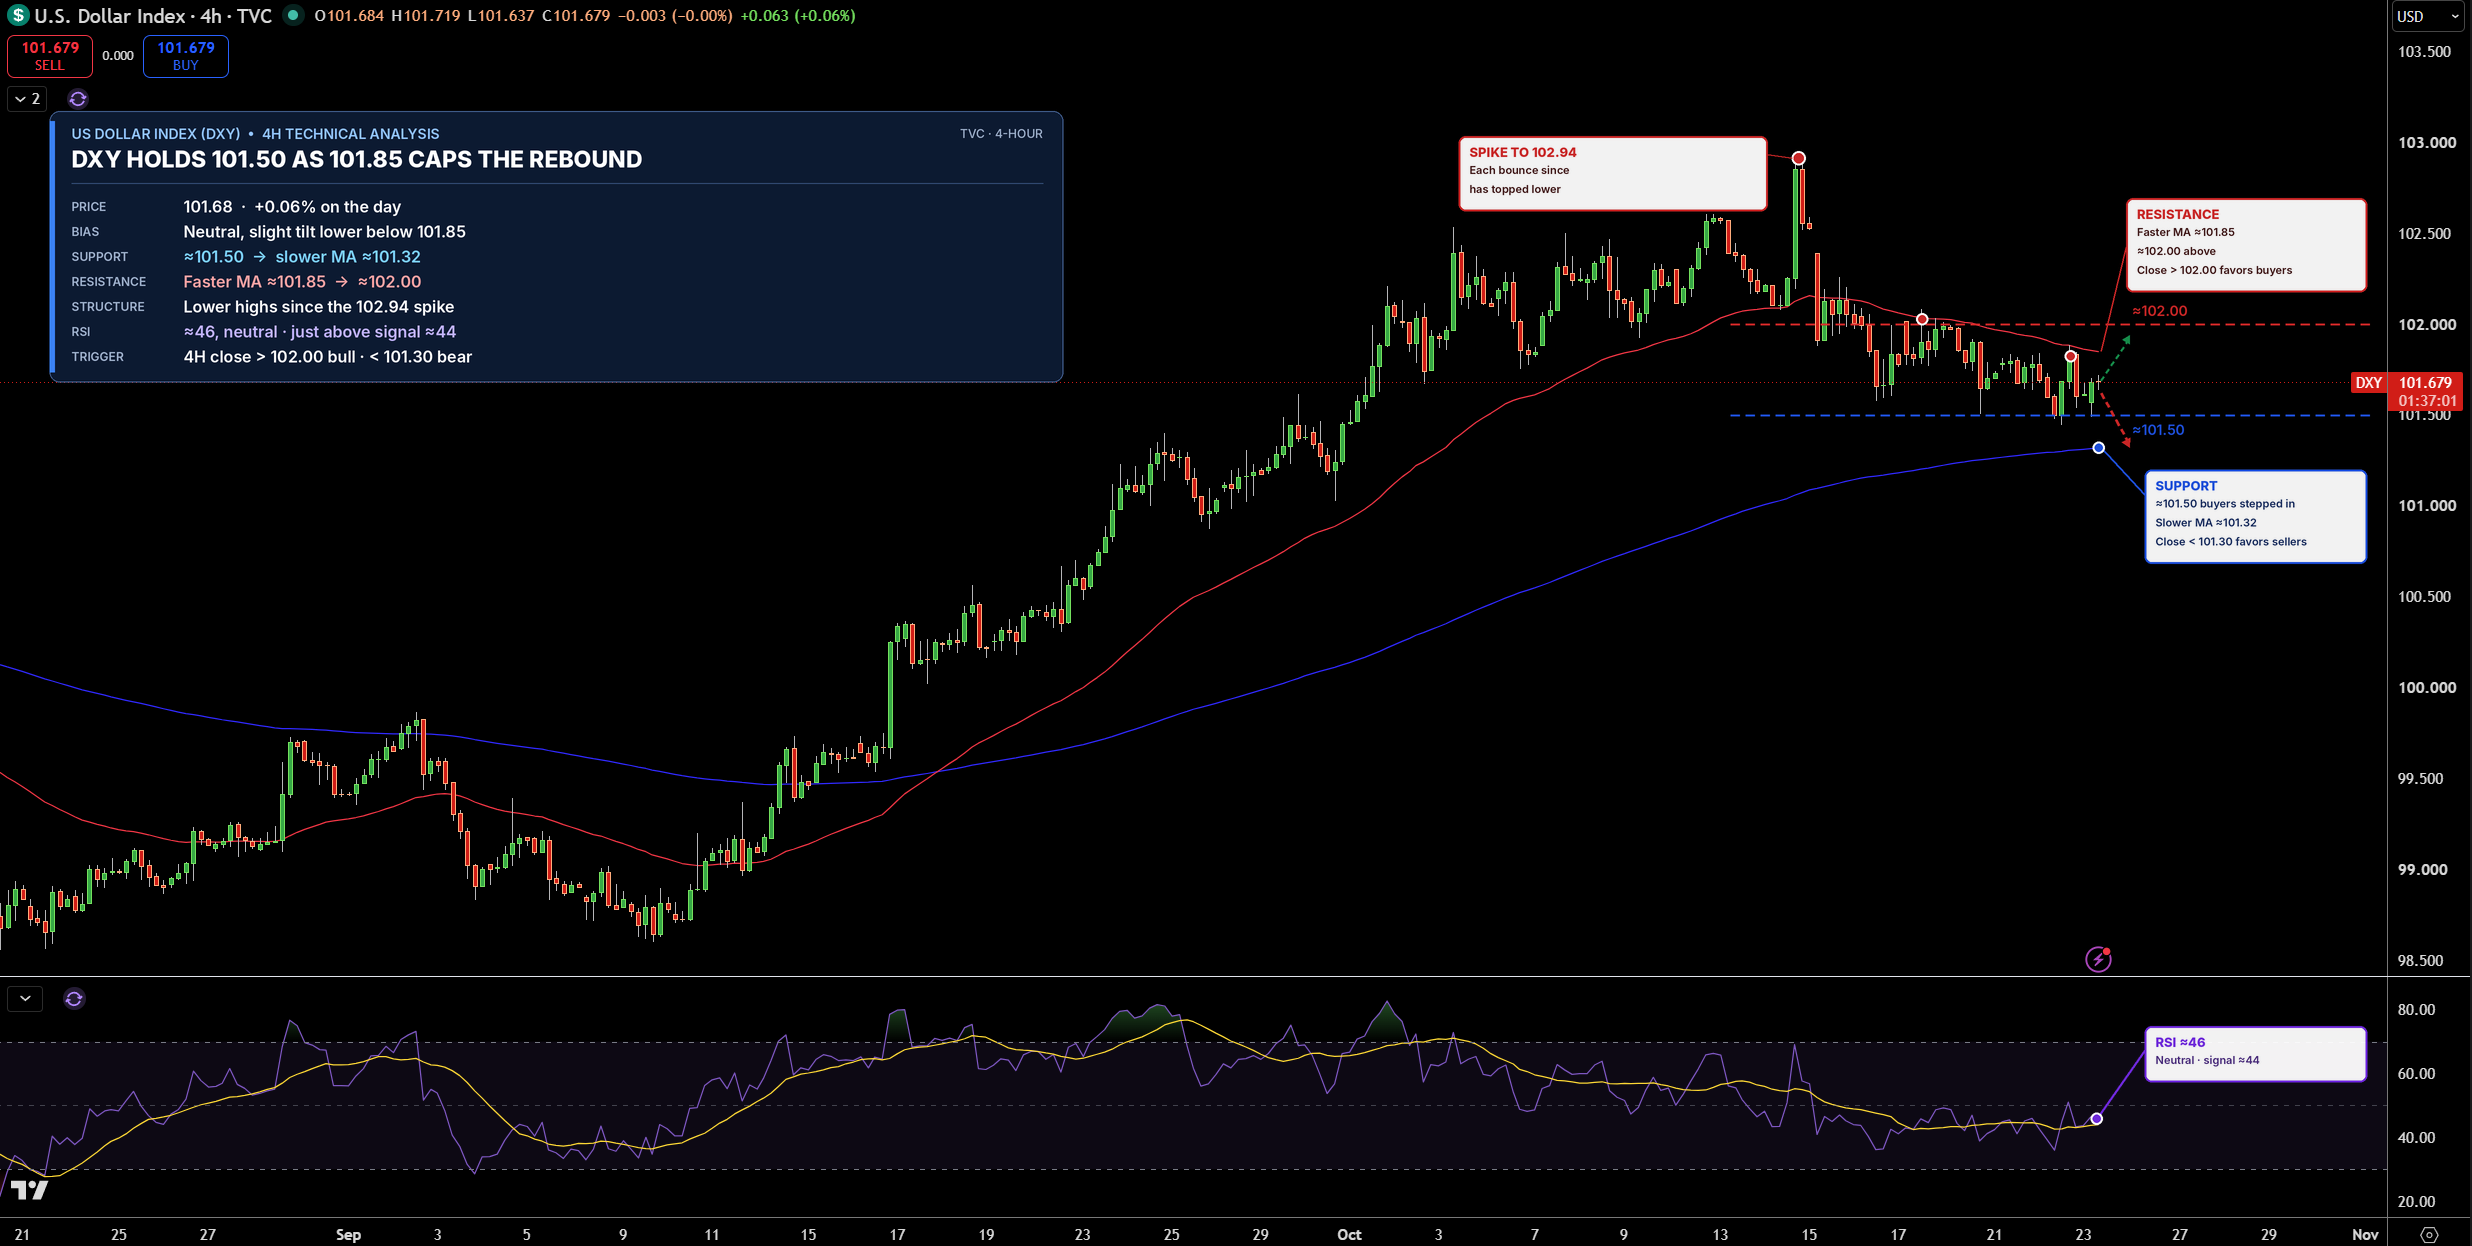
The US Dollar Index is trading near 101.68 on the 4-hour chart. Since the rise to 102.94 in mid-October, each bounce has topped out lower. DXY now sits below the faster moving average near 101.85, a line that tracks the recent average price.
Resistance, where sellers tend to step in, starts at 101.85, followed by 102.00. Support, where buyers have stepped in before, is 101.50, followed by 101.30.
RSI, which measures the strength of recent buying and selling, is near 46, which is neutral. My bias is neutral with a slight bearish lean while DXY stays below 101.85. A move above 102.00 would favor buyers, while a close below 101.30 would favor sellers.
EUR/USD Technical Analysis: Euro Holds Inside Triangle as 1.1257 Breakout Test Nears
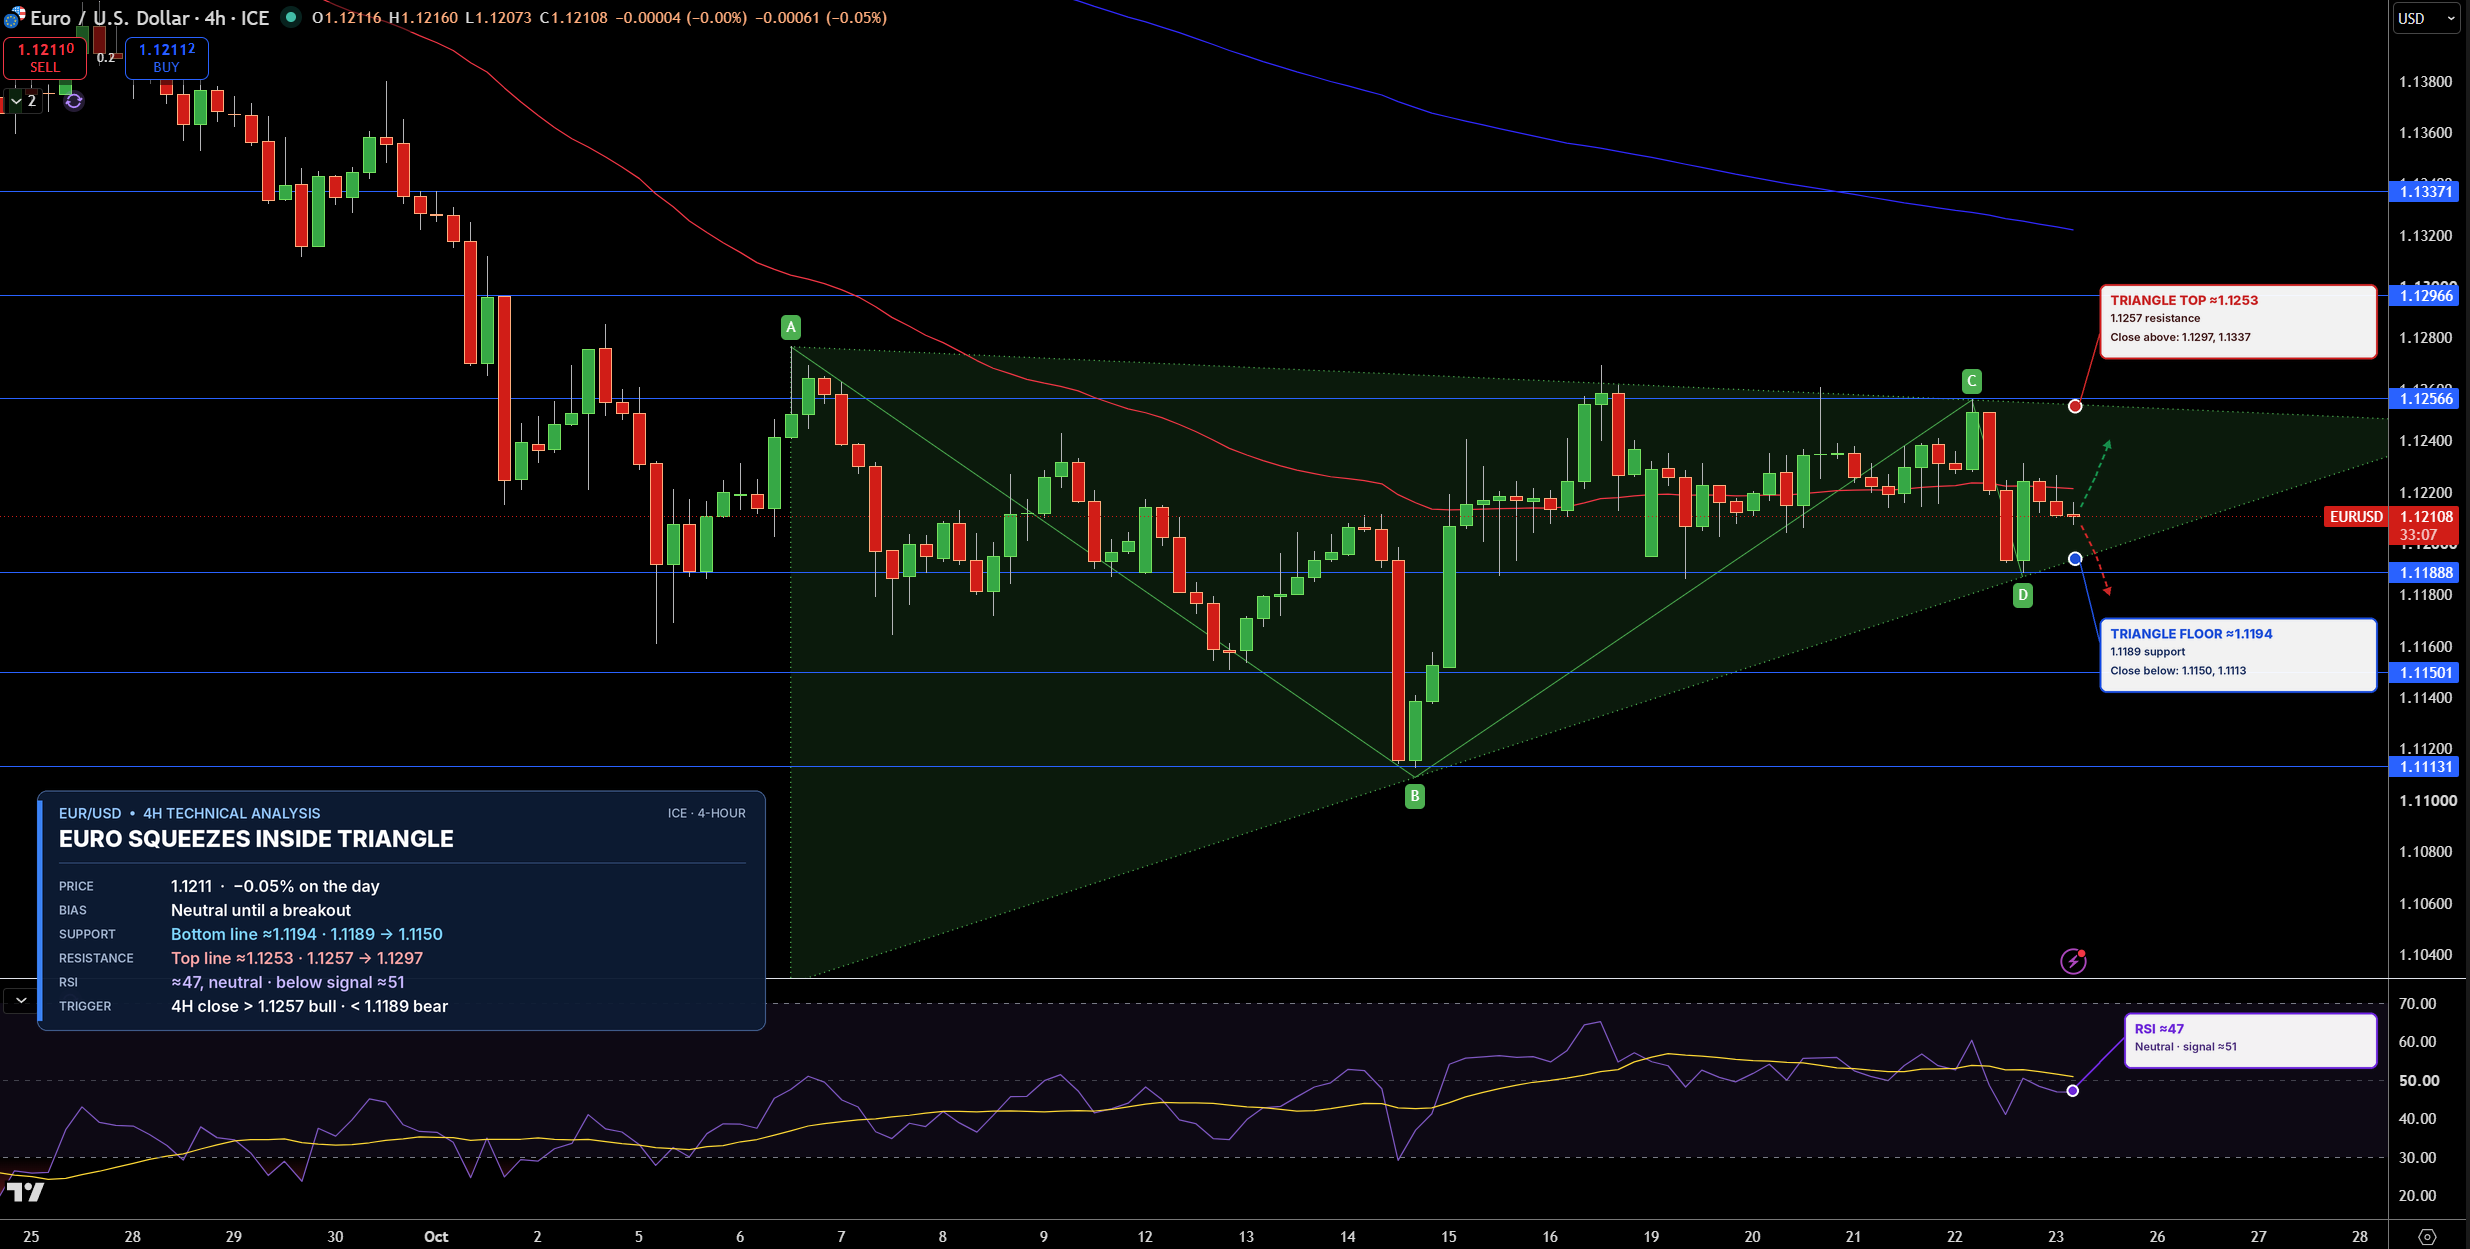
EUR/USD is trading near 1.1211 on the 4-hour chart, inside a triangle. In this pattern, the price swings get smaller between a falling top line and a rising bottom line, and that often comes before a bigger move.
The top of the triangle at 1.1257 is the first resistance, followed by 1.1297. The bottom line at 1.1189 is the first support, then 1.1150.
RSI is near 47, also neutral, so I would wait for the breakout before taking a side. A close above 1.1257 would favor buyers, while a drop below 1.1189 would favor sellers.
GBP/USD Technical Analysis: Pound Stalls Below 1.3407 as 1.3356 Support Holds
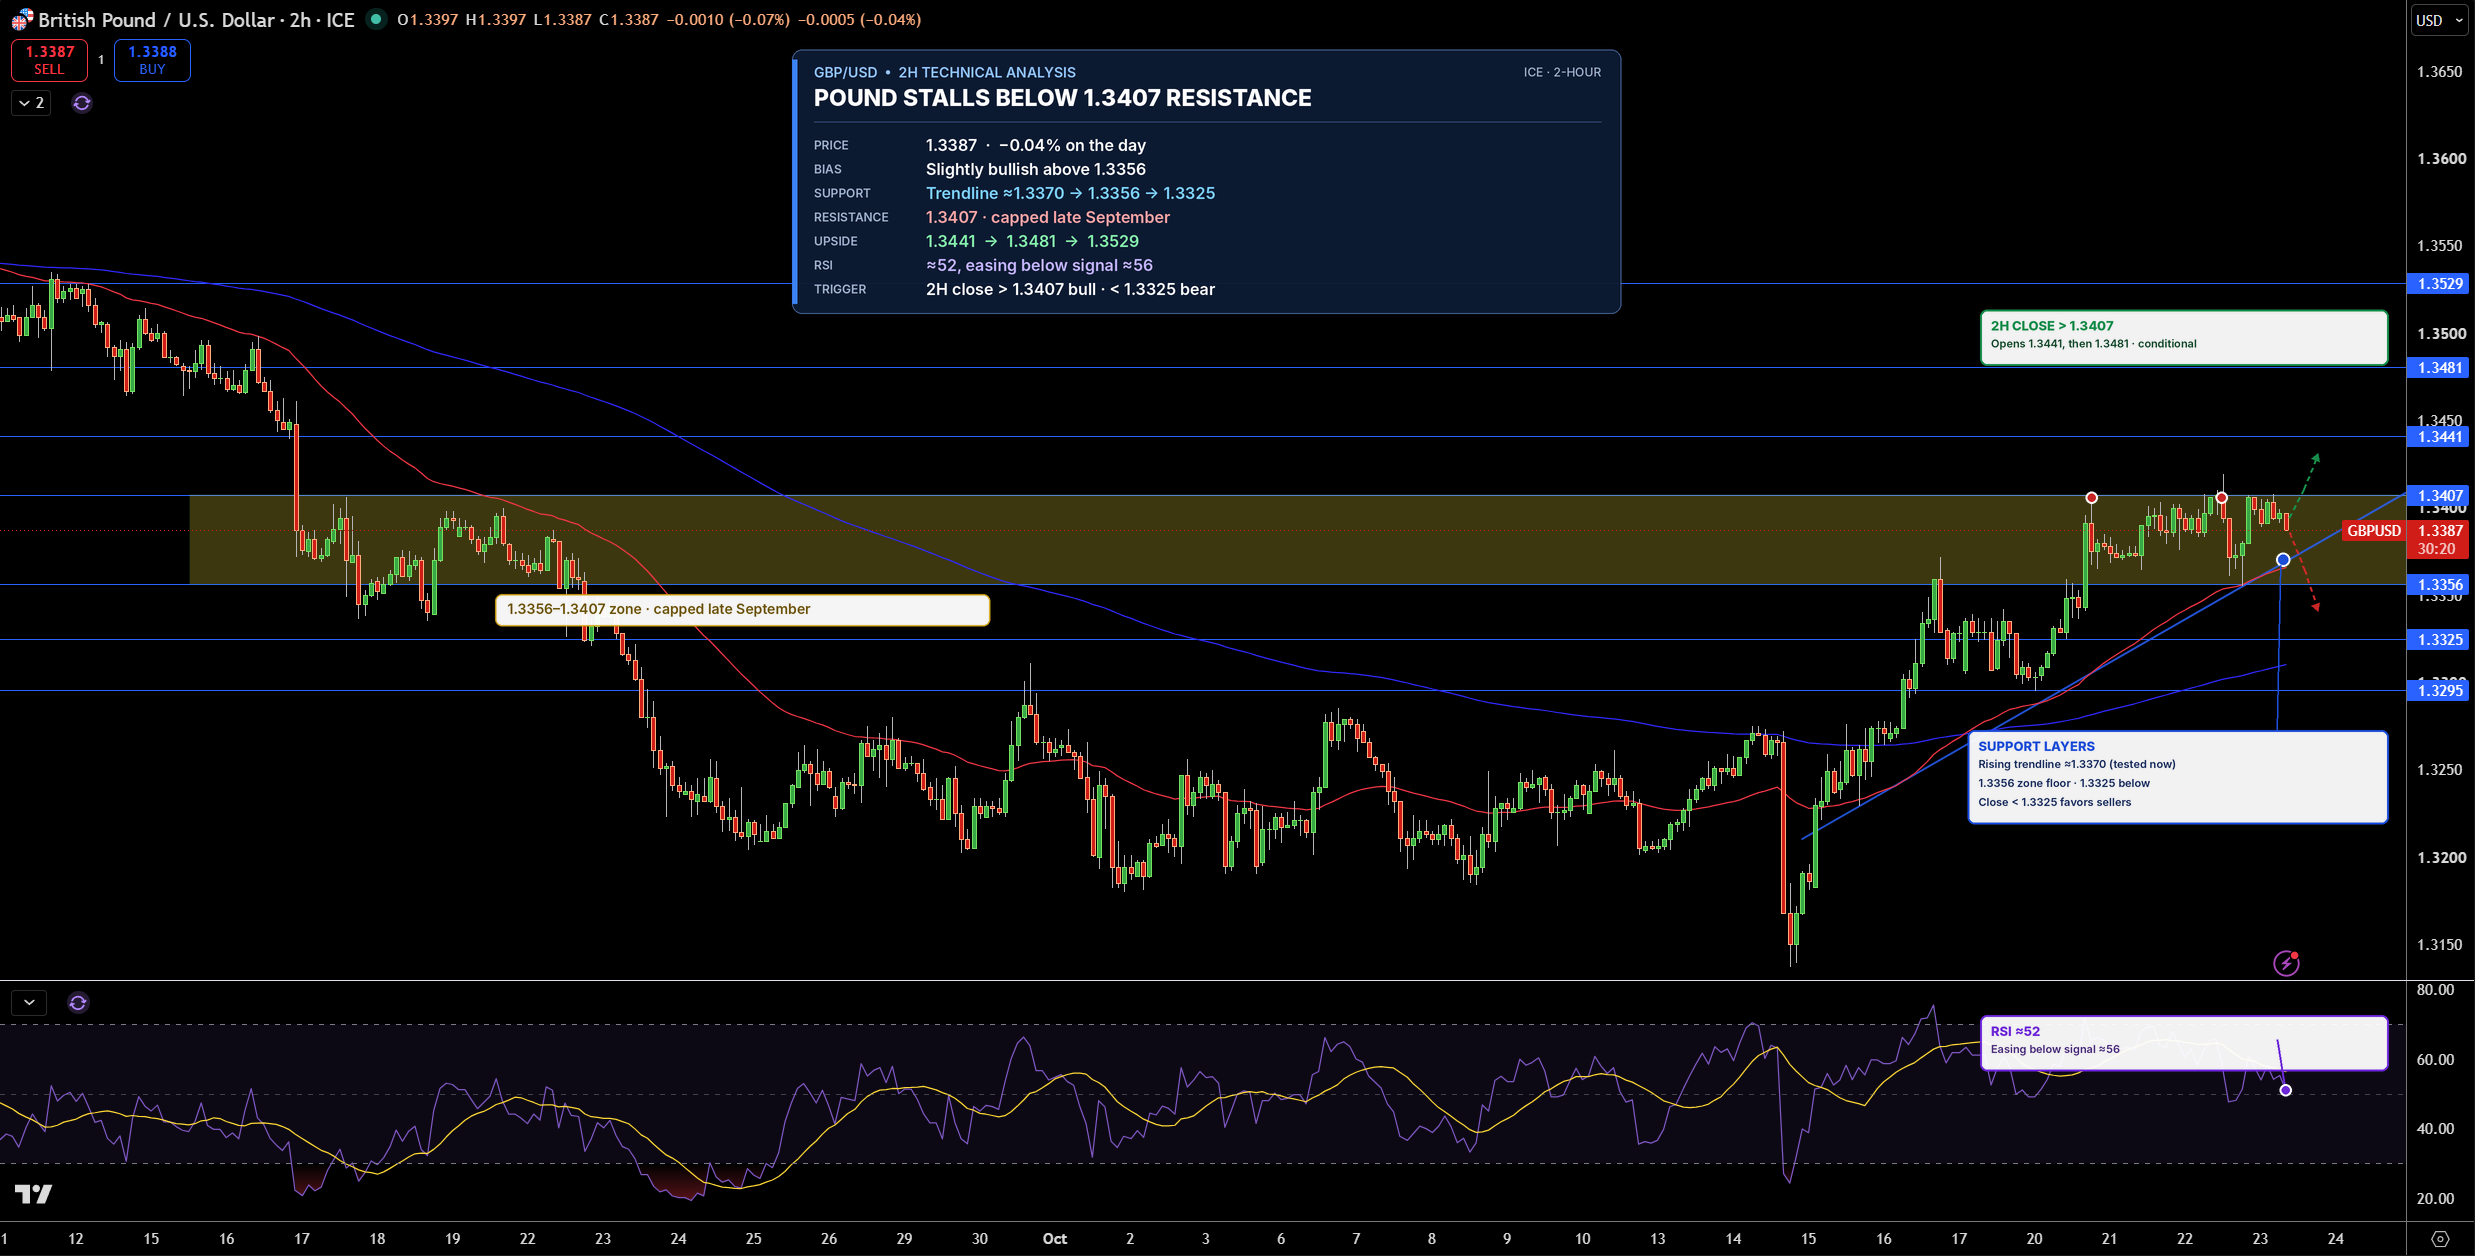
GBP/USD is trading near 1.3387 on the 2-hour chart, just below 1.3407, a level that also capped prices in September. A rising trendline, which connects the recent higher lows, still supports the recovery.
The first resistance is 1.3407, then 1.3441. On the downside, 1.3356 is the first support, followed by 1.3325.
RSI is near 52 and easing, which shows buyers are losing some steam. In my view, the pound keeps a slight bullish lean while it holds above 1.3356. A close above 1.3407 would open the way higher, while a drop below 1.3325 would favor sellers.