


Henry Hub Natural Gas’s near-term outlook is being thrown around by a couple of competing factors. The first one is a modest national storage cushion and an official weather forecast that favors warmth across some of the most important regions in the United States.
Latest Weather Report
NOAA’s Climate Prediction Center issued its latest available outlook at 3 p.m. Eastern yesterday, and for November 1–5, above-normal temperatures are favored across the central and eastern contiguous United States, with probabilities exceeding 70% over much of the East. This is a pattern that could put a damper on early heating demand relative to a colder outcome.
It’s a forecast of temperature categories, not necessarily a measure of actual gas consumption, and a 70% probability of above-normal temperatures doesn’t mean demand will fall 70% in reaction. Regional population, building use, and the size of the temperature departure from estimates could determine the eventual effect.
Storage Situation
The current storage situation is more balanced than a simple supply surplus would suggest. EIA’s October 22 release estimated Lower 48 working gas at 3,644 billion cubic feet as of October 16, following a 77 billion cubic feet weekly injection. That was 35 billion cubic feet above the average between 2021 and 2025 of 3,609 billion cubic feet, but 152 billion cubic feet below the year-earlier comparison.
The chart below puts those comparisons on a common zero-base scale, with a roughly average starting cushion providing some flexibility, while the year-over-year shortfall cautions against assuming the system has the same reserve margin as it did last year.
Natural Gas Price Forecast
Every new Natural Gas analysis as it publishes, today's technical signal and key levels, live price — on one page.
See all Natural Gas forecasts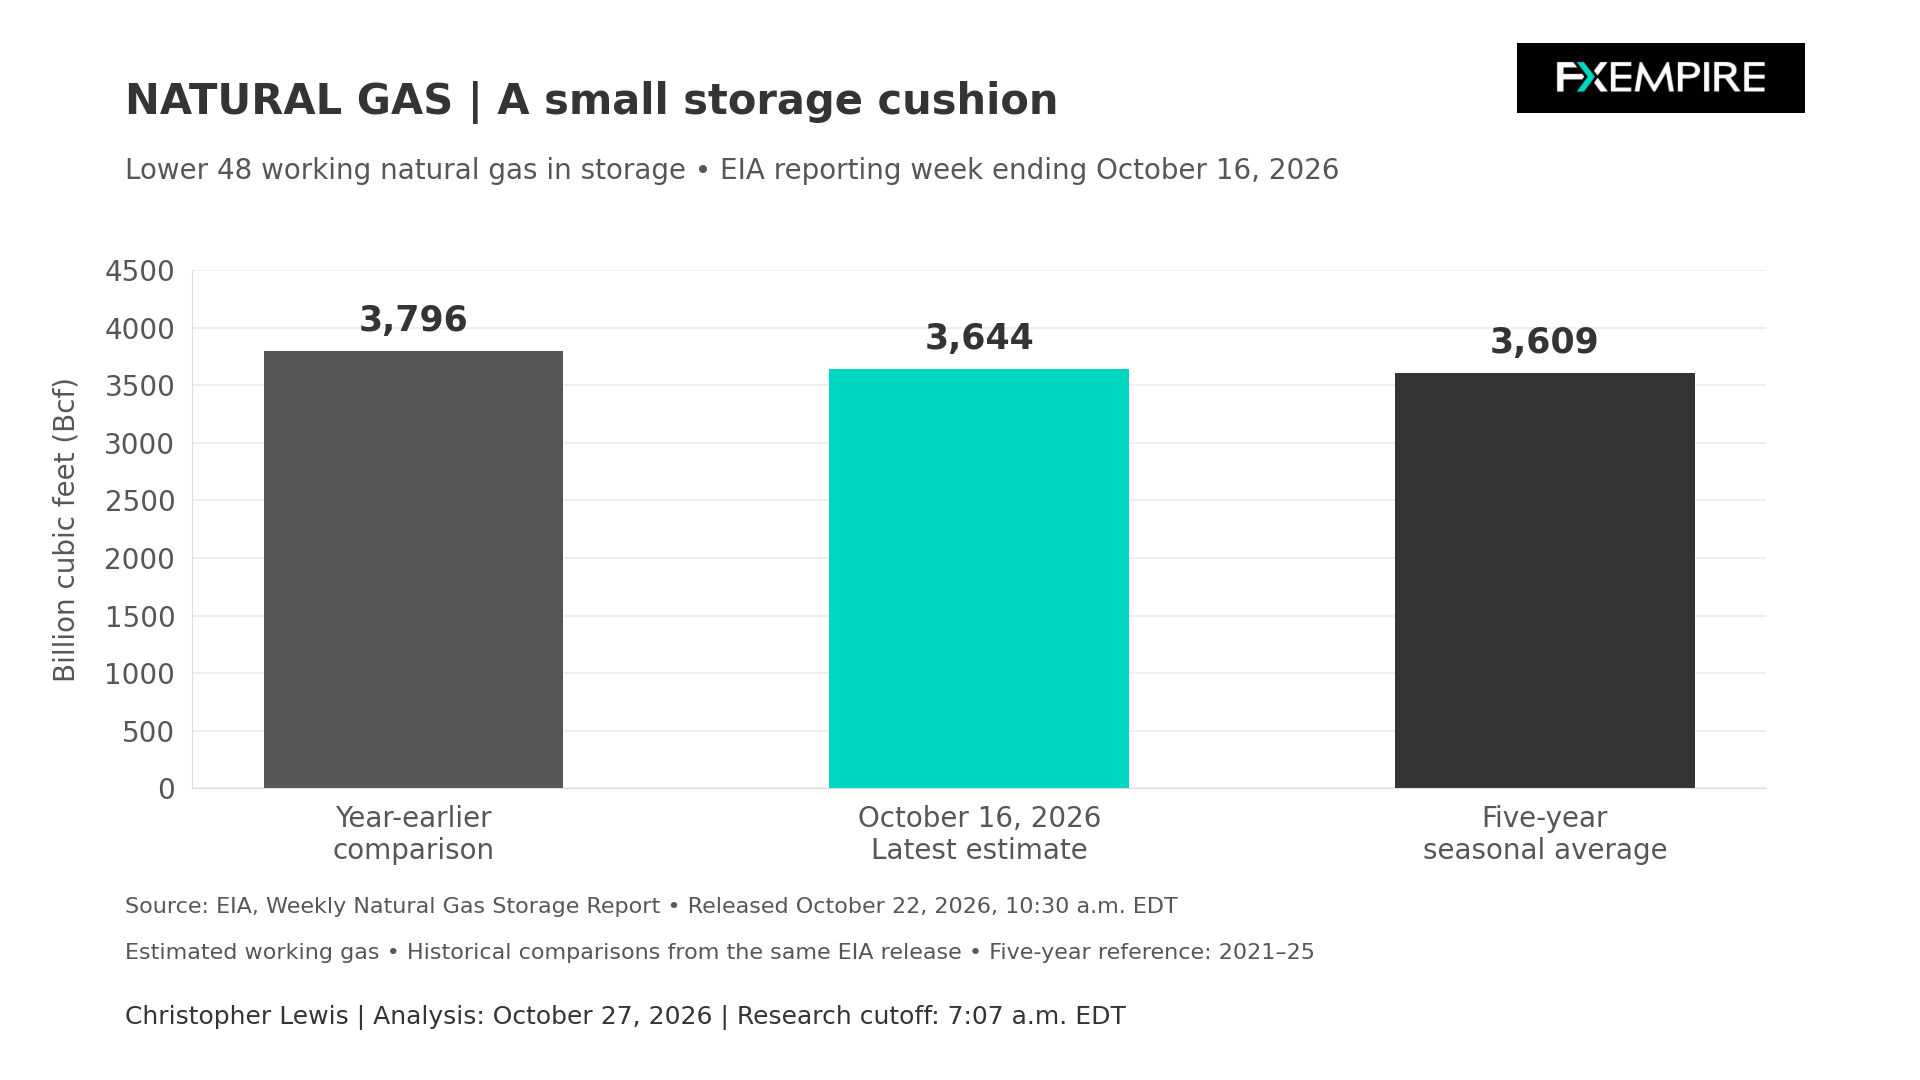
Regional Stocks
Regional stocks matter, with South Central Storage being recorded at 1,125 billion cubic feet, 3.4 percent below its five-year average. Salt cavern stocks were 251 billion cubic feet, 14.9% below their corresponding average. These regional figures don’t necessarily contradict a small national surplus. It just shows that the location and type of stored natural gas can differ from the overall picture.
For Henry Hub, a broad national balance should be assessed alongside Gulf region requirements. A pipeline constraint or a change in export demand can affect regional availability even when countrywide inventories look comfortable. There have been no new pipeline disruptions or terminal shutdowns, so this is not part of the equation.
EIA’s October 6 outlook projects U.S. dry production averaging 112.20 billion cubic feet per day in 2026 and 116.13 billion cubic feet per day next year. It forecasts LNG exports of 17.6 and 18.6 billion cubic feet, respectively. These are annual forecast averages, not verified flow rates or confirmation that a specific amount of export capacity is being utilized.
Balance Matters
Balance will be everything here. More production could meet additional export demand while limiting persistent upward pressure on prices. The timing will matter, of course. Output growth arriving after a period of strong withdrawals would not prevent an earlier tightening. Conversely, weaker exports or mild weather in the winter could allow more supply to remain available for domestic storage.
It’s worth noting that EIA finalized its model inputs on October 1 before publishing October 6 and says the forecast won’t necessarily be able to specifically incorporate any news from later market events. Its projected Henry Hub annual averages should therefore be used as conditional background information.
The next EIA storage report is scheduled for Thursday at 10:30 a.m. Eastern. The important thing will be to watch how the reported injection compares to the seasonal balance and whether national and South Central cushions improve together.
Electricity Demand
Power demand will also add a bit of a complication at the moment. Warmth can reduce heating requirements without producing the strong air-conditioning load associated with midsummer. This will vary by region, obviously, and generating mix, so temperature alone cannot establish the size of gas-fired generation demand. Observing weather, electricity consumption, and fuel use will be needed to judge whether forecast warmth translates into a looser gas balance.
Warmer forecast conditions lean against an immediate heating-demand acceleration that you would quite often see this time of year, while the uneven inventory buffers preserve sensitivity to revisions. Colder forecasts, stronger measured export flows, or verified supply loss would strengthen the tightening case.
Setup for Trading
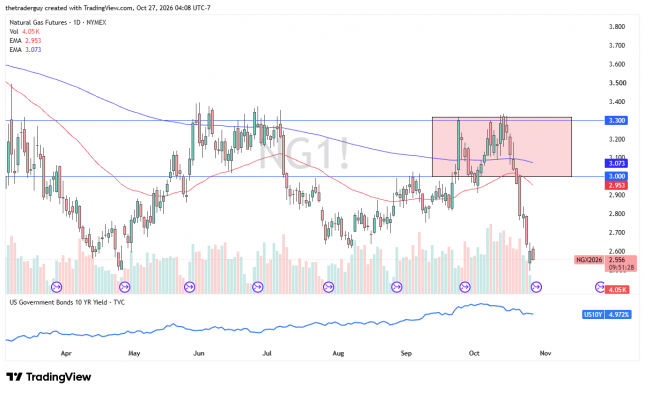
The technical analysis for natural gas does look almost like it is a value-hunting type of situation, as it has fallen so drastically that short covering could help lift pricing, and one has to be thinking that the market will eventually try to find a bottom. After all, we are at April prices, and we are heading in the opposite direction as far as the calendar is concerned.
Given enough time, I do expect natural gas to bounce, but perhaps the Thursday storage report needs to be out of the way before we start to see buyers come in and pick up natural gas. As things stand right now, though, weather is not cooperating. The $2.50 level seems to be the bottom in the market at the moment. I would anticipate $2.80 being a bit difficult to crack above, right along with $3.
If you’d like to know more about how to trade natural gas, please visit our educational area.