


It starts the day with a couple of influences pulling in opposite directions. We have elevated U.S. real yields raising the financing costs of holding non-interest-bearing assets, while the metal continues to retain a high nominal price following a year of geopolitical and inflation chaos.
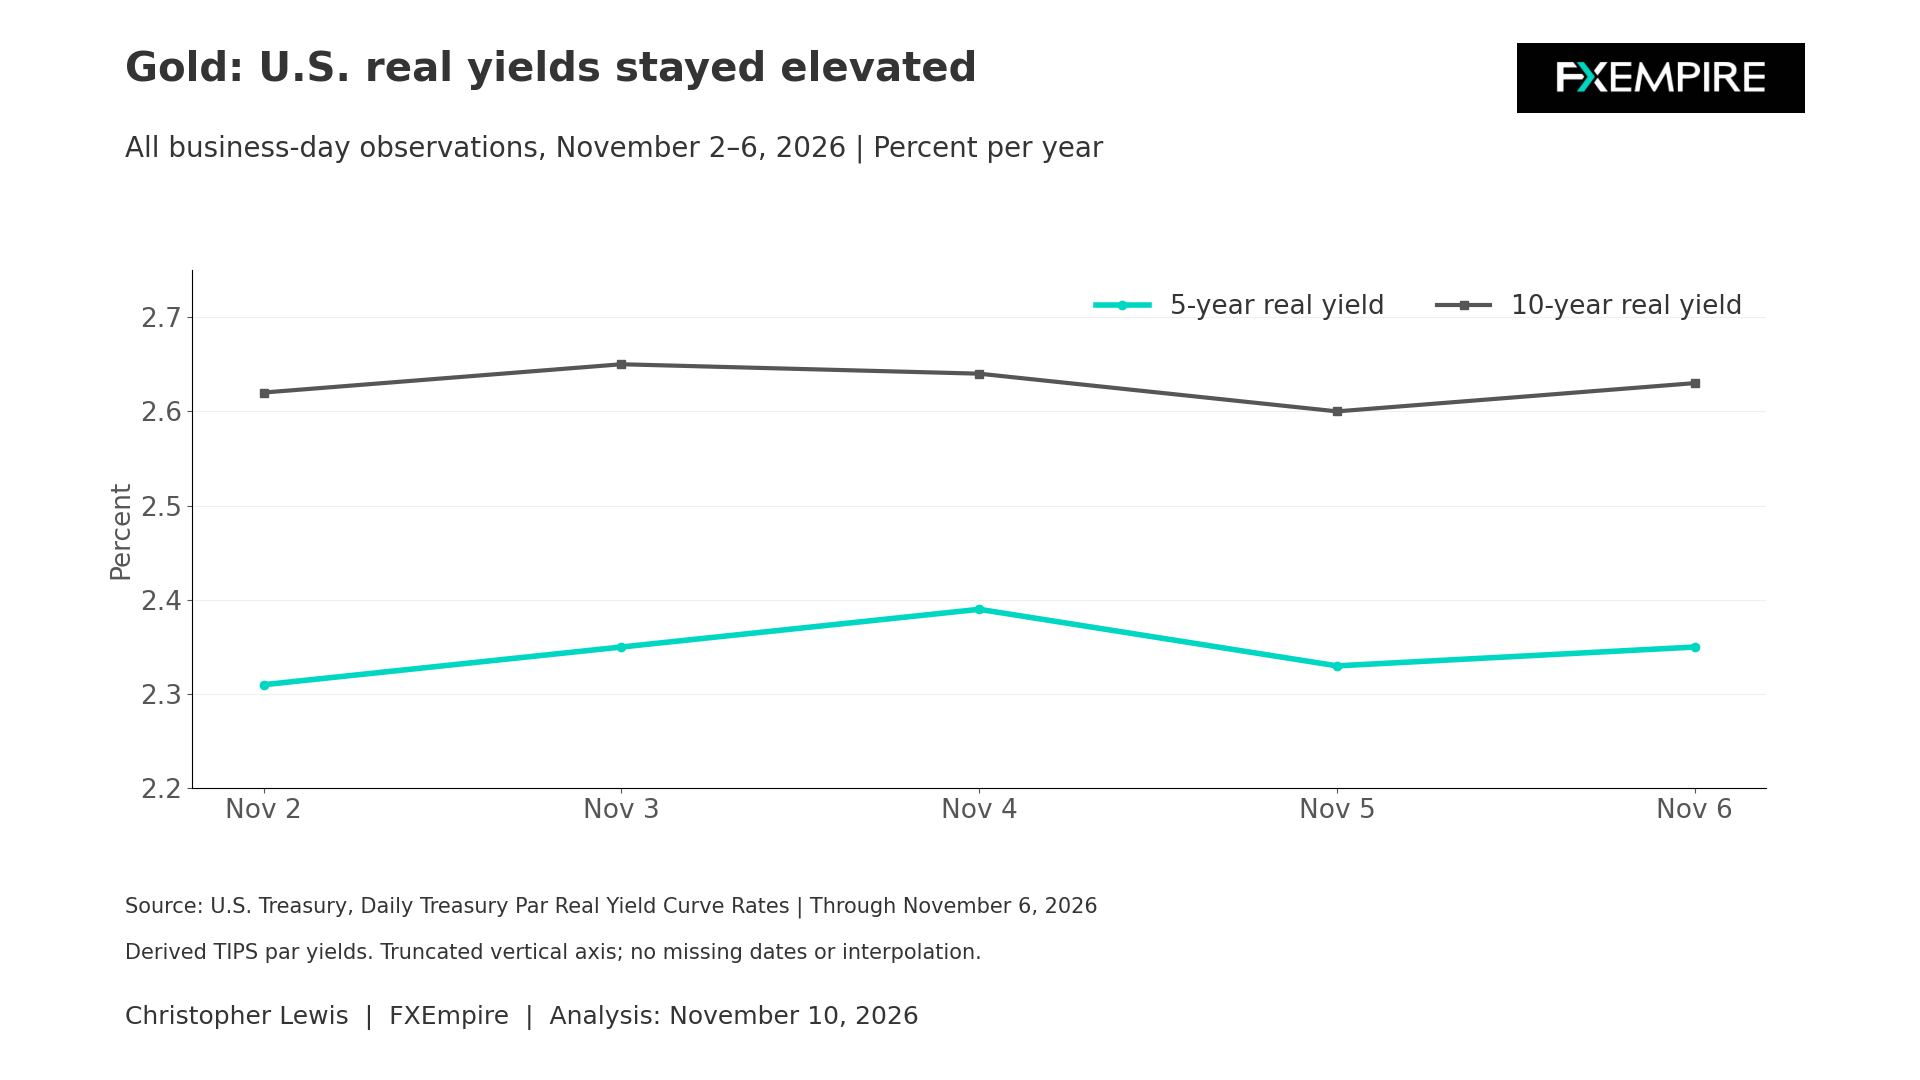
The latest official available settlement date listed the December 2026 COMEX gold contract at $4,074.90. The real-rate backdrop remains restrictive. The U.S. Treasury’s daily real yield curve placed the 5-year real yield at 2.35% and the 10-year yield at 2.63% on November 6. Across every business day that week, the 5-year measure remained between 2.31% and 2.39%, with the 10-year yield staying between 2.60% and 2.65%. These are derived TIPS par yields. They don’t establish a mechanical inverse relationship with gold, but they do represent part of the opportunity cost and a high hurdle for an asset that produces no coupon or interest payments.
CPI Hotter on Tuesday
On Tuesday, the BLS reported Core CPI at 0.3%, above the expected 0.2%, and CPI m/m at 0.4%, higher than the expected 0.3% for the month of October. This continues to be a thorn in the side of doves, and should continue to put pressure on the Fed to remain restrictive.
Jobs in America
Friday’s labor report gave the market an additional policy input that shouldn’t be ignored. The Bureau of Labor Statistics reported that nonfarm payroll employment increased by 165,000 jobs in October, while the unemployment rate came in at 4.1%. The labor market is still expanding, which can reduce pressure for rapid monetary easing, although payrolls alone don’t determine Federal Reserve policy. Nonetheless, more employment typically means that more consumers are out there, with inflation having that input.
For gold, the overall relevant information runs through expected policy rates, nominal Treasury yields, inflation compensation, and the dollar, rather than just through employment itself. A higher inflation reading supports gold’s store-of-wealth narrative, but it could also lift yields if investors expect a firmer policy path. A softer reading could reduce nominal and real yields while also weakening demand for inflation protection.
Shape of the Curve
The shape of the real yield curve also deserves attention. On November 6, the 30-year real yield was 3.07%, above the 20-year rate of 2.91% and the 10-year rate of 2.63%. This upward slope implies investors demand progressively more inflation-adjusted return at longer maturities. For the gold market, the long end can matter through portfolio allocation and the cost of carrying defensive positions. A fall confined to short maturities would be less supportive than a broad decline across the entire curve.
Gold Price Forecast
Every new Gold analysis as it publishes, today's technical signal and key levels, live price — on one page.
See all Gold forecastsProductivity Can Help
BLS reported on November 5 that third-quarter nonfarm business productivity rose at a 3.6% seasonally adjusted annual rate, with output up 3.7% and hours worked up 0.1%. Unit labor costs fell 0.7% during the quarter but were 2.4% higher than a year earlier. Strong productivity can allow output and wages to grow with less inflationary pressure, potentially modifying and moderating the monetary premium embedded in gold.
Technical Setup
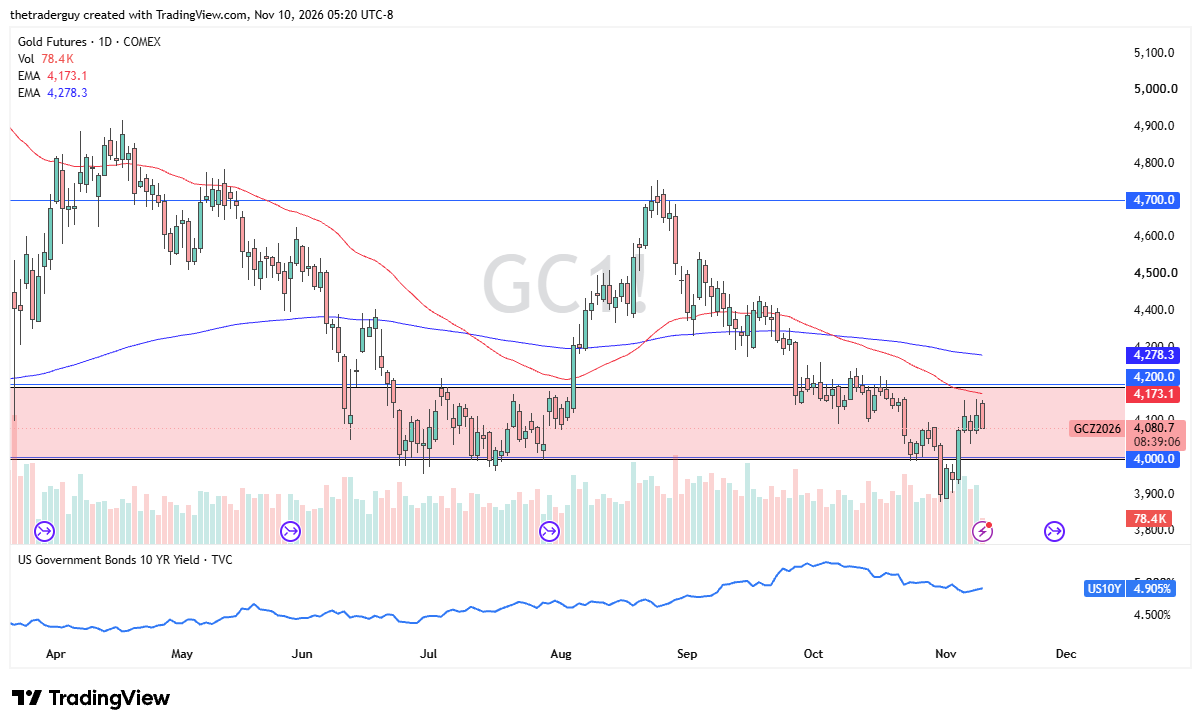
The near-term narrative depends on whether real yields break out of last week’s narrow, elevated range and what the reaction to subsequent inputs is this week. For what it is worth, the gold market gapped higher to kick off the trading session and has since fallen. It still looks very much like a market that is struggling to get above $4,200, and with the 50-day EMA sitting just above, the technical outlook for this market suggests stagnation, possibly even weakness. A daily close above $4,250 would change my attitude on this, though.