


Breakout Momentum Challenges Dominant Downtrend
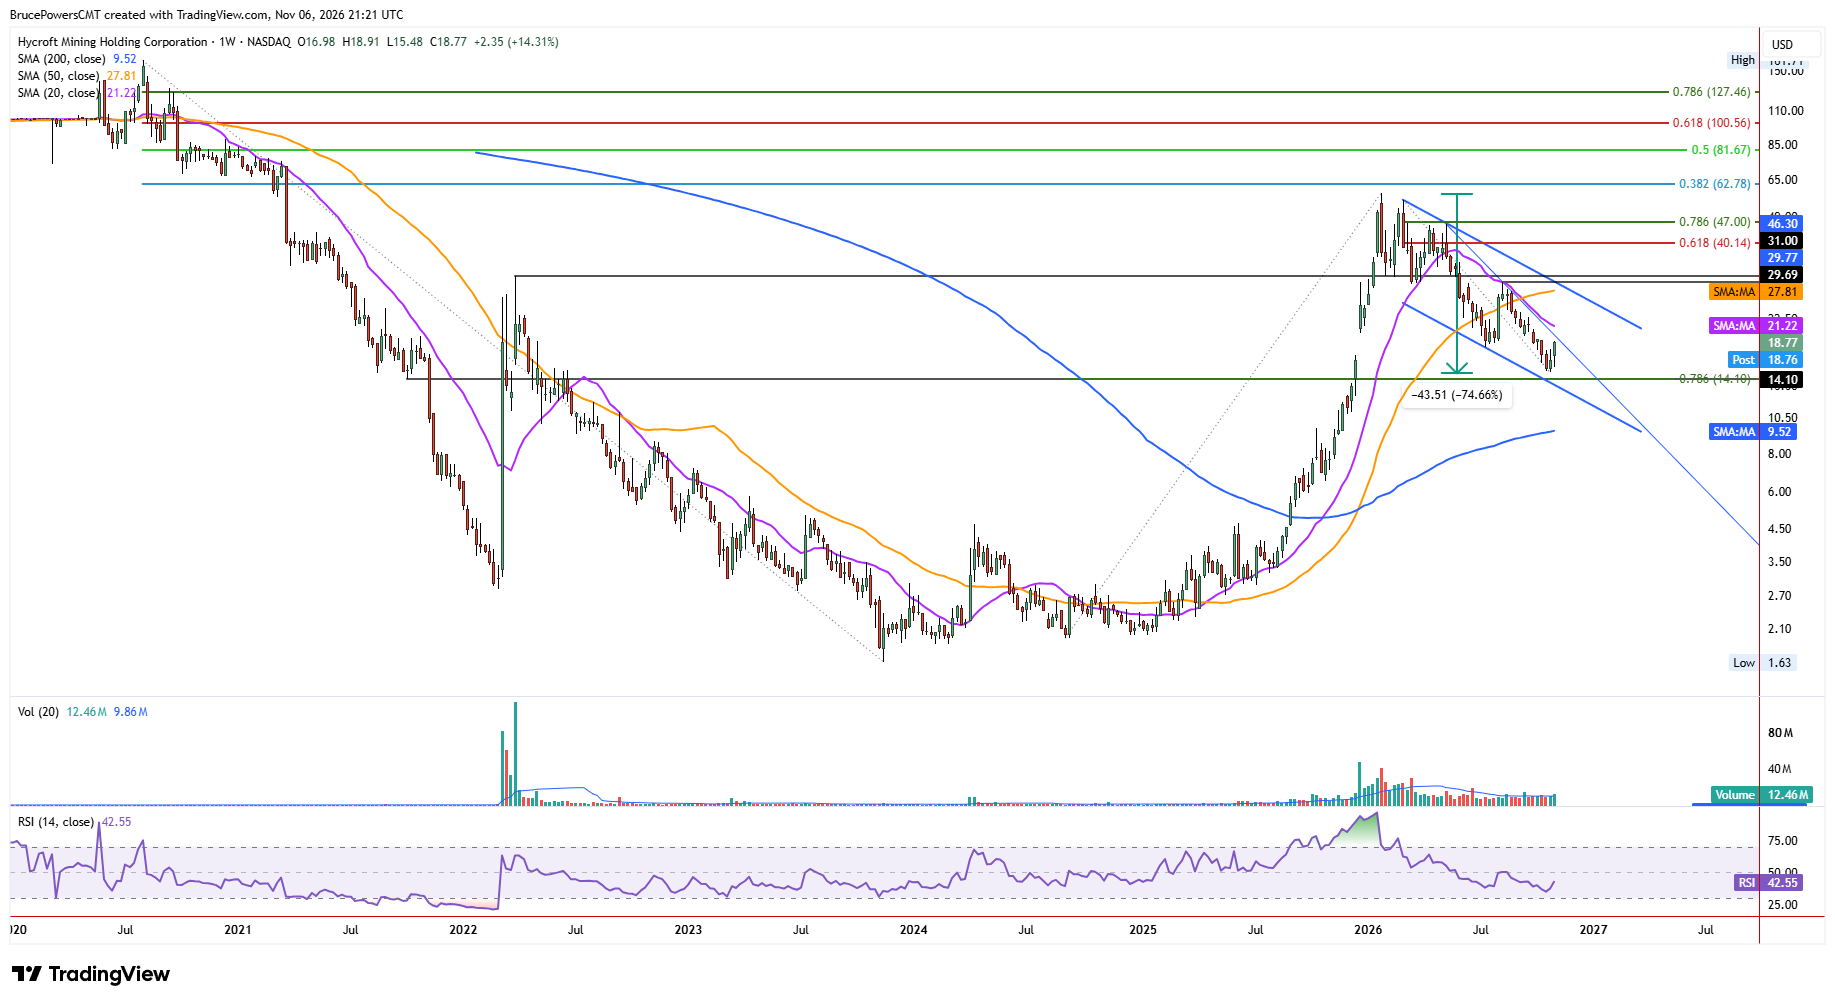
Hycroft Mining Corporation (HYMC) is a U.S. precious metals miner offering significant exposure to silver. This week it confirmed an upside breakout above last week’s high of $17.80, closing at $18.77, after reaching a high of $18.91. For the week, the stock was up by $2.35 (or 14.31%). This was bullish price action showing buyers retaining control into the weekend and strengthening the weekly bullish reversal signal. It suggests that a new advance has likely begun. However, the breakout remains counter to the larger dominant declining trend channel.
Deep Correction Finds Support at Key Price Zone
At last week’s low of $14.88, HYMC had declined by 74.6% from the January peak of $58.73. That high correlated with a peak in spot silver, while HYMC may have bottomed a week before silver, which reached a new low this week. The low was established at the confluence of several support indicators, most notably the 127.2% Fibonacci extension of the prior advance at $14.82. The lower boundary of a falling trend channel also reinforced the support zone.
Moving Averages Define Next Resistance Targets
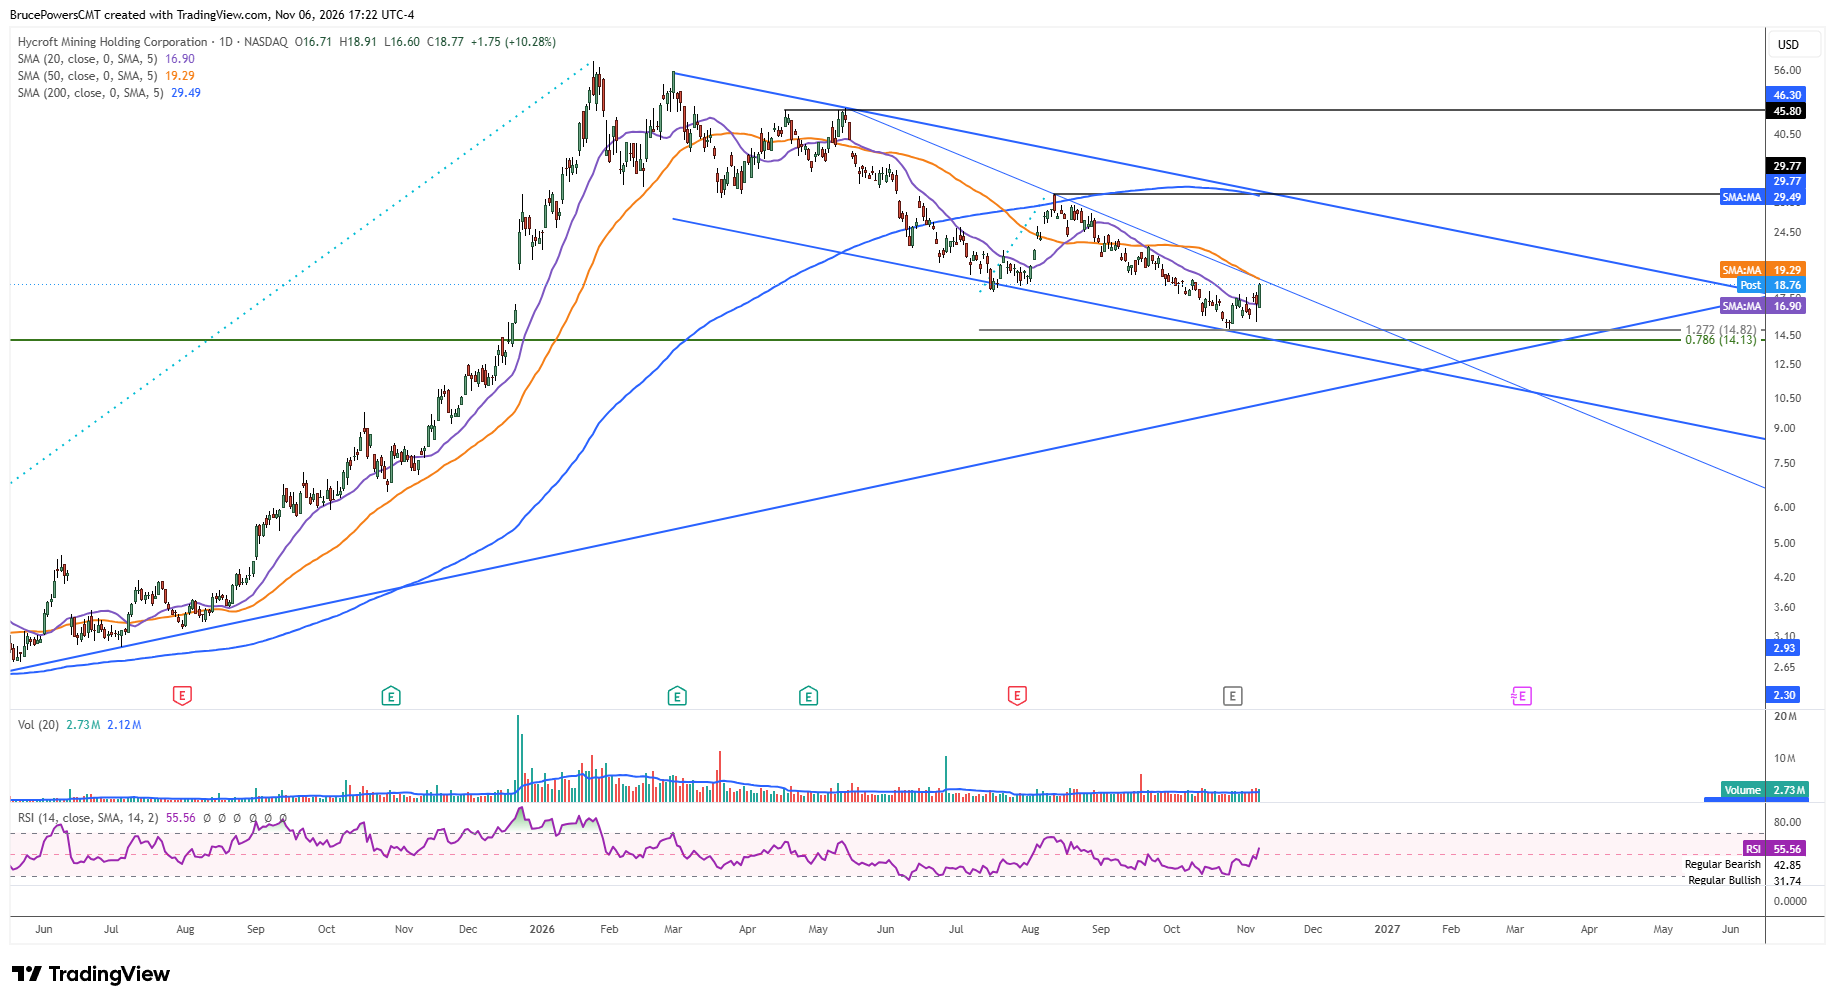
The weekly bullish reversal from the lower boundary of the channel suggests a potential recovery to eventually test resistance at the top boundary of the pattern. On the daily chart, that level would currently be aligned near the falling 200-day moving average at $29.49 and falling. A lower swing high at $29.77 provides another initial upside target. On the weekly chart, HYMC faces key dynamic resistance near the 20-week moving average at $21.22 and falling. Notably, unless there is a sharp spike to the lower swing high very soon, the downtrend could be broken before price reaches that target.
$29.77 Breakout Could Confirm Trend Reversal
A recovery above the lower swing high at $29.77 would provide further confirmation of a bullish reversal for the larger declining trend. That would begin to change the longer-term outlook for HYMC. Until then, resistance can be anticipated at the levels noted above. A sustained move through these resistance levels would strengthen the case that the recent low marked an important long-term bottom.
If you’d like to know more about technical analysis and how traders use it, please visit our educational area.