


Earnings Reaction Signals a Change in Character
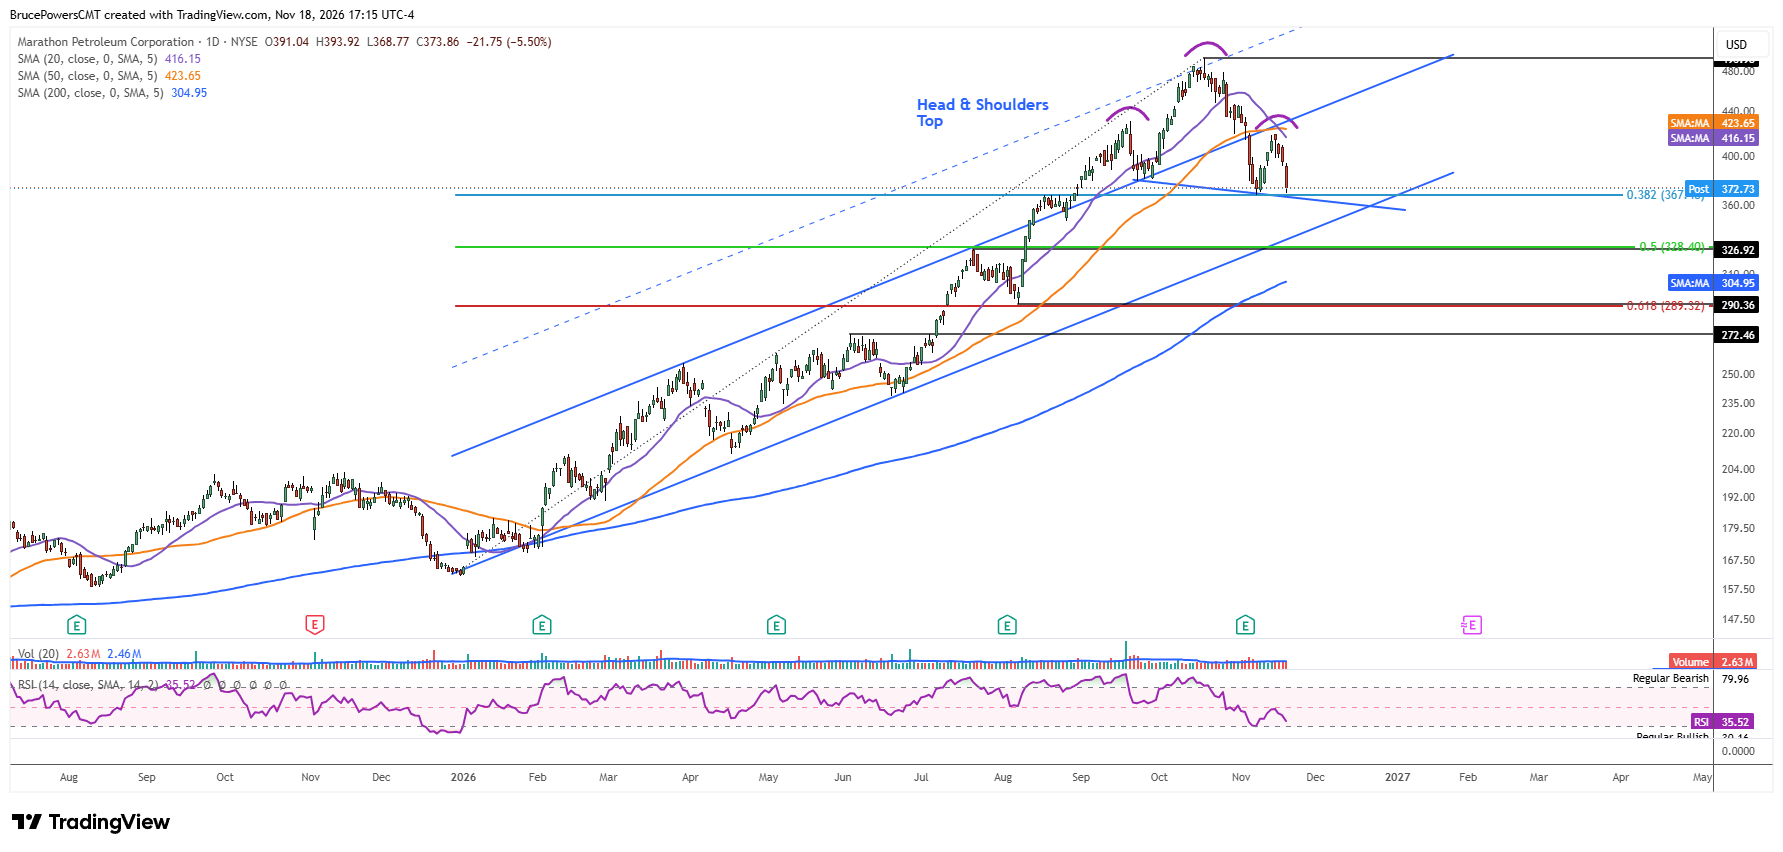
Marathon Petroleum (MPC), an oil and gas refining and marketing company, reported Q3 2026 earnings last Tuesday, November 3, before the market open. The initial reaction was slightly bearish, but the next day sentiment was clearer, as MPC broke below its 50-day moving average for the first time since January, suggesting a possible change in character.
Moving Average Resistance Reinforces Bearish Momentum
The decline subsequently generated a bearish trend reversal signal on a break below the recent higher swing low of $378.80 from September, before a low was reached at $367.72. A counter-trend rally followed and tested resistance near the 50-day moving average, resulting in a lower swing high on the daily chart at $419. The confirmation that the average had switched to resistance suggested that at least one more leg down was likely in the bearish correction. This shift in the moving average’s role is particularly significant given how long it had previously acted as support.
The bearish correction in MPC correlates with recent weakness in crude oil prices, adding to downside pressure. Recently, short-term bearish momentum was indicated by the 20-day moving average crossing below the 50-day moving average. This bearish alignment of the shorter-term moving averages reinforces the deterioration in bullish momentum. Together, these developments suggest that MPC is poised to go lower and is now at a pivotal location to provide a new bearish signal. A decisive breakdown of nearby support would provide further confirmation that sellers remain in control.
Head-and-Shoulders Breakdown Puts Support to the Test
A potential head-and-shoulders topping pattern has now formed in MPC, and it tested support near the neckline of the pattern on Wednesday with a decisive decline to a low of $368.77. Consequently, a drop below the recent low of $367.72 will signal a continuation of the decline that followed the $493.98 peak in October and trigger the breakdown of the topping pattern.
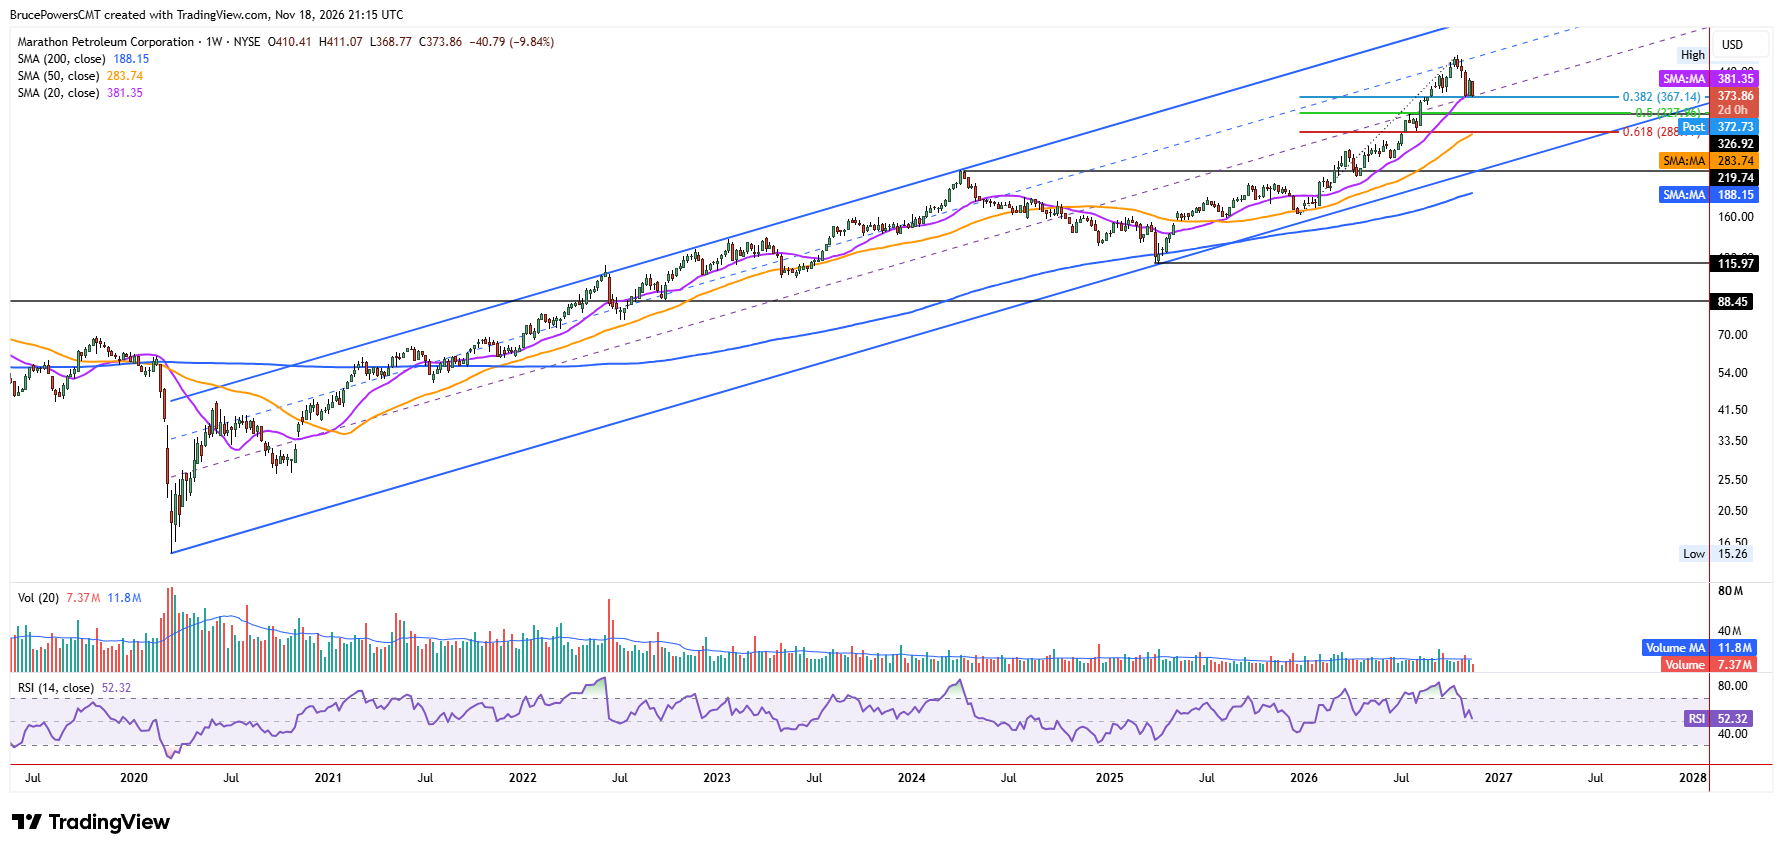
In addition, support near the low is reinforced by the 20-week moving average on the weekly chart, currently near $381.35. This is the third consecutive week that the average has been recognized as support, along with the midline or a rising trend channel. A breakdown would therefore represent a failure of several nearby support indicators rather than simply a violation of the recent daily low.
Deeper Fibonacci Confluence Targets Emerge
The combination of support indicators suggests that a breakdown could accelerate bearish momentum and increase the chance that more significant support targets may eventually be tested. There are two confluence zones marking initial downside targets, each derived from prior price structure and a Fibonacci retracement level of the prior advance that began from the December 2025 low. The first is at the prior high of $326.92 and the second at a prior swing low at $290.36. These levels provide progressively lower downside objective if the neckline breakdown is confirmed, extending the bearish implications of the reversal that began after the October peak.
If you’d like to know more about technical analysis and how traders use it, please visit our educational area.