


NASDAQ 100 Technical Analysis
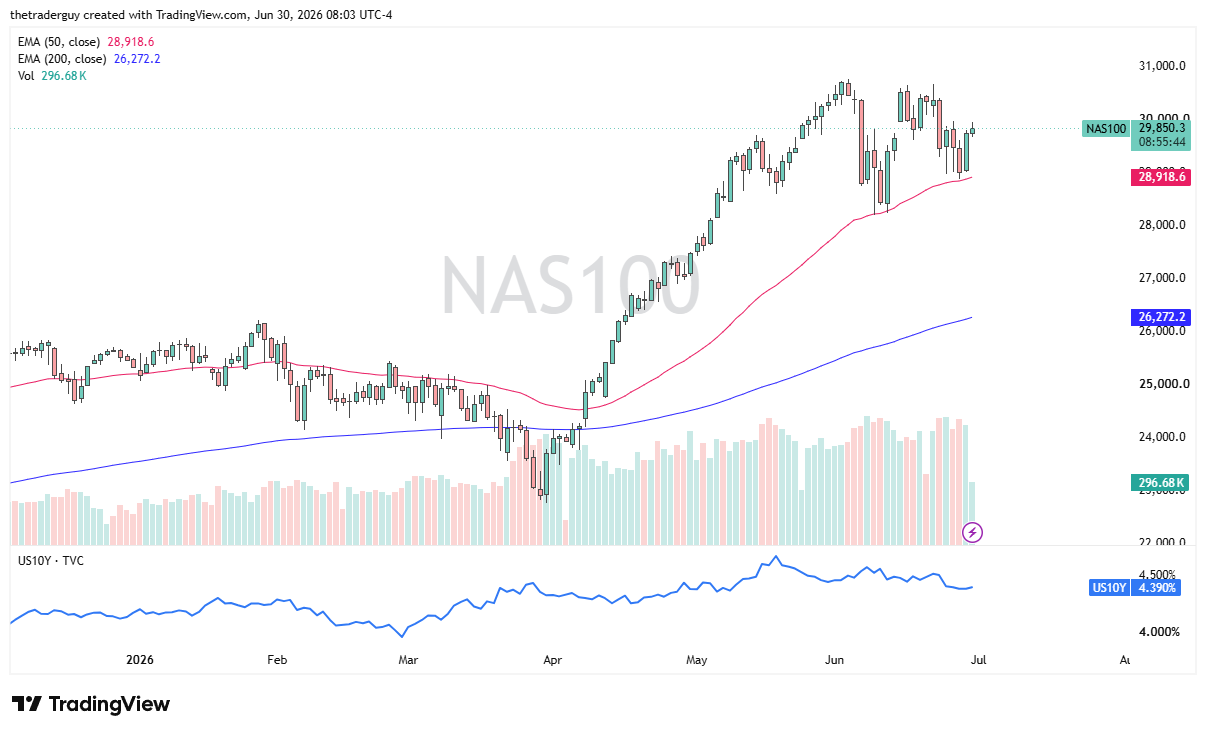
The Nasdaq 100 looks very much like an index that is trying to rally in, but the 30,000 level could offer a little bit of resistance. If we can break above there, then I think we can press to the upside, perhaps towards the 30,500 level. Short-term pullbacks, I think, open up the possibility of a floor near the 50-day EMA. The 50-day EMA is sitting just below the 29,000 level, and therefore, I think you’ve got a situation where you’re looking to buy the dip.
Dow Jones 30 Technical Analysis
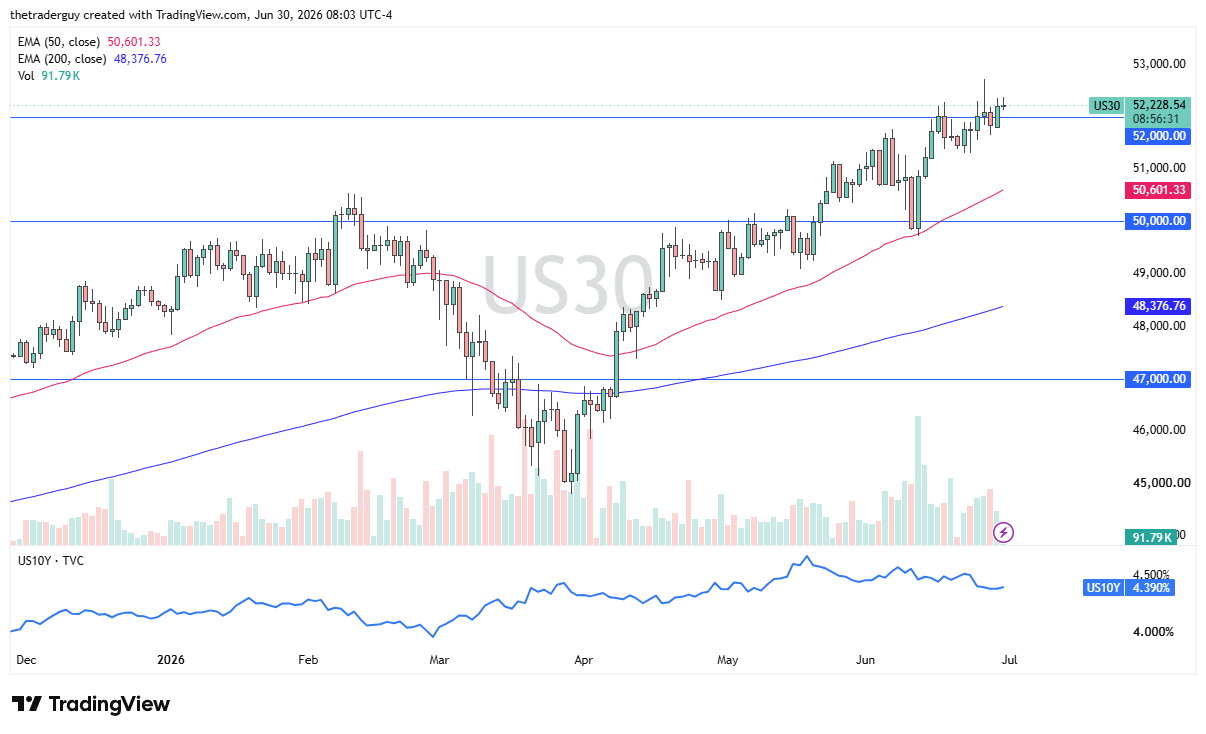
The Dow Jones 30 is pretty quiet early during the trading session, as interest rates are slightly higher but really not taking off. We are hanging around the 52,000 level, and at this point in time, I’m looking at this through the prism of a market that’s trying to build up enough momentum to finally break out as we are working off some of the excess froth from before.
If we can break above the 52,500 level, then it’s likely that the market could go to the 53,000 level. Short-term pullbacks continue to be buying opportunities near the 51,500 level.
S&P 500 Technical Analysis
NASDAQ 100 Price Forecast
Every new NASDAQ 100 analysis as it publishes, today's technical signal and key levels, live price — on one page.
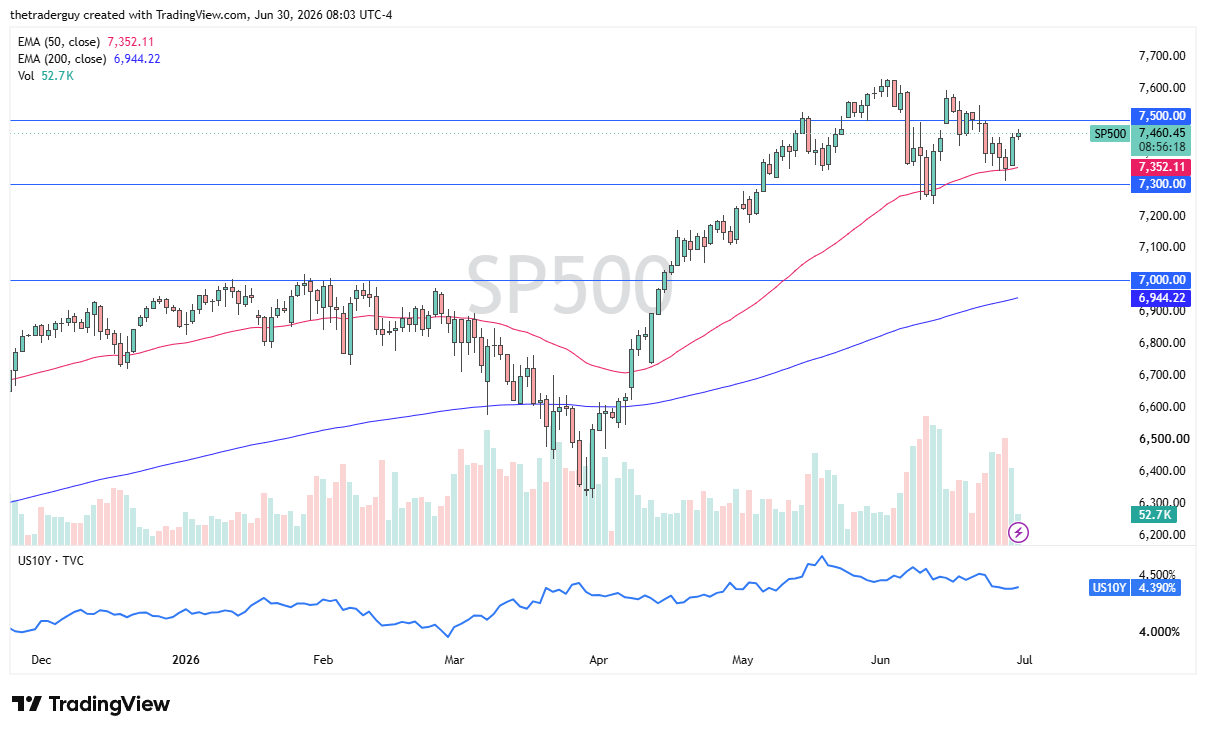
See all NASDAQ 100 forecastsThe S&P 500 is slightly positive during the early part of the session as well, and I think that is a sign that we may try to test the 7500 level. Short-term pullbacks should have plenty of support near the 50-day EMA at 7352 and rising. I don’t have an interest in shorting this market. I think this compression is the market trying to build up a reason to go higher.
Volume is reasonable at the moment. It certainly looks as if we are trying to settle some type of question. But unless something changes quite drastically in the world, this looks like a market that is just working off some froth and ready to go higher.
If you’d like to know more about chart patterns and how to trade them, please visit our educational area.