



Nasdaq 100 came under renewed pressure on Monday and closed lower despite the strong earnings reported by Microsoft Corp (MSFT). Investors want to see how much cash companies can generate after paying their growing AI bills. The negative free cash flow for Alphabet Inc. (GOOGL) has added to those concerns. A recovery in chip stocks could help Nasdaq but another selloff would add pressure to the index. For now, the market is watching for 28,000 as the key support. A weekly close below this level may deepen the correction while a move above 29,800 could open the way toward 31,400.
Inki Cho, Senior Financial Markets Strategist at Exness, commented:
The Nasdaq 100 is finding it hard to bounce back, as investors worry about how much big tech is spending on AI. Microsoft’s results were strong, with its cloud business still growing fast, but Alphabet spent more than it brought in this quarter, and its shares fell over 10%. Chip stocks could help lift the index if their recent rebound holds. For now, 28,000 is the level to watch, while a move back above 31,400 could open the way to 35,000.
Strong Cloud Growth Fails to Ease Nasdaq’s AI Spending Fears
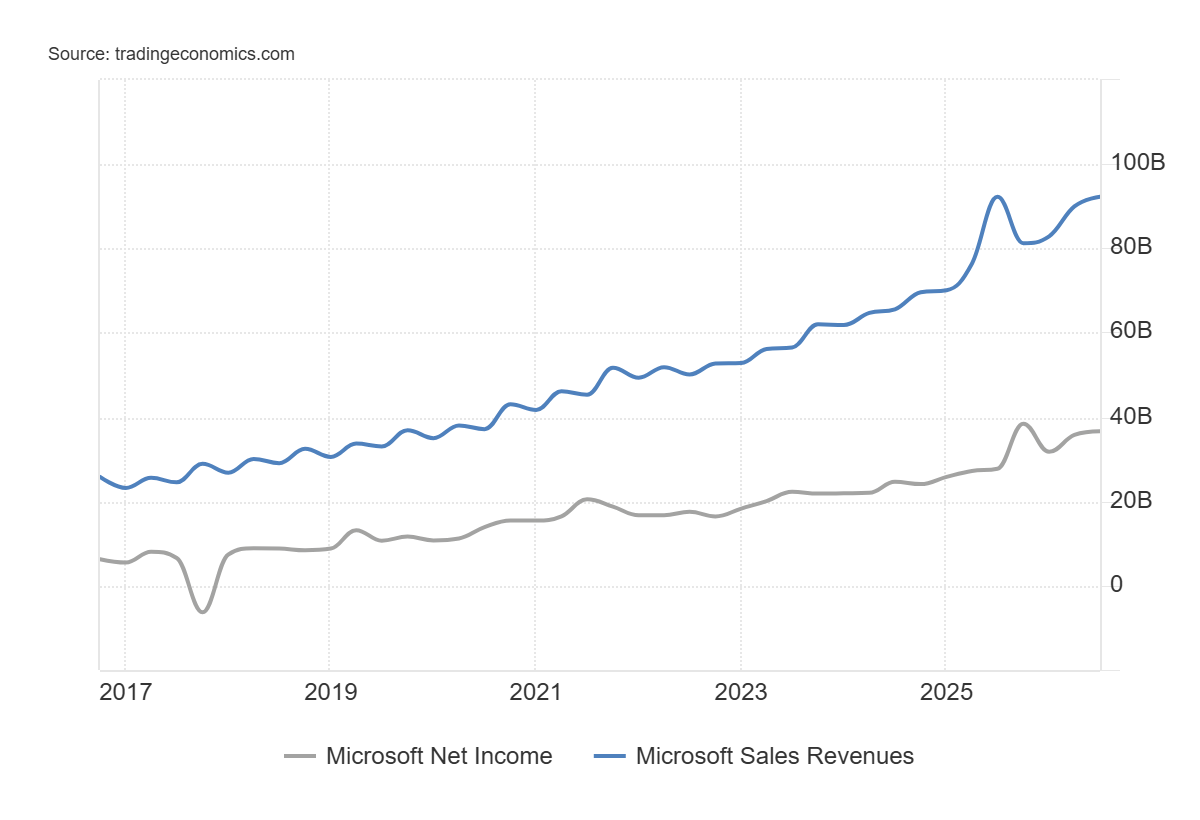
The growth in cloud remains strong but concerns about the costs for AI continue to increase pressure on Nasdaq. Microsoft reported strong earnings for FYQ1 2027. The company reported 19% increase in revenue to $92.3 billion for FYQ1 2027. The revenue for Azure grew 48% which suggests that demand for cloud services remains high.
The company also generated $18.6 billion in free cash flow. The chart below shows that the company has been generating strong revenue during the past decade. The company has recovered from the slowdown in Q2 and continues to generate strong revenue and net income.
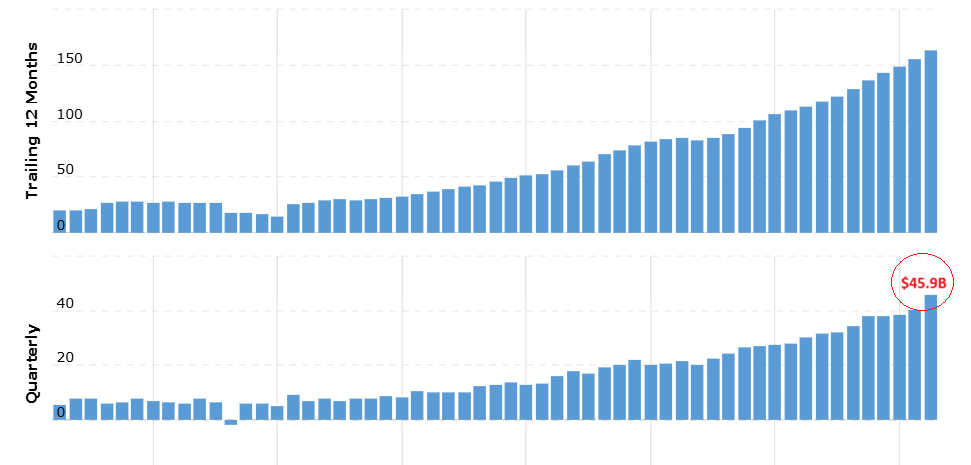
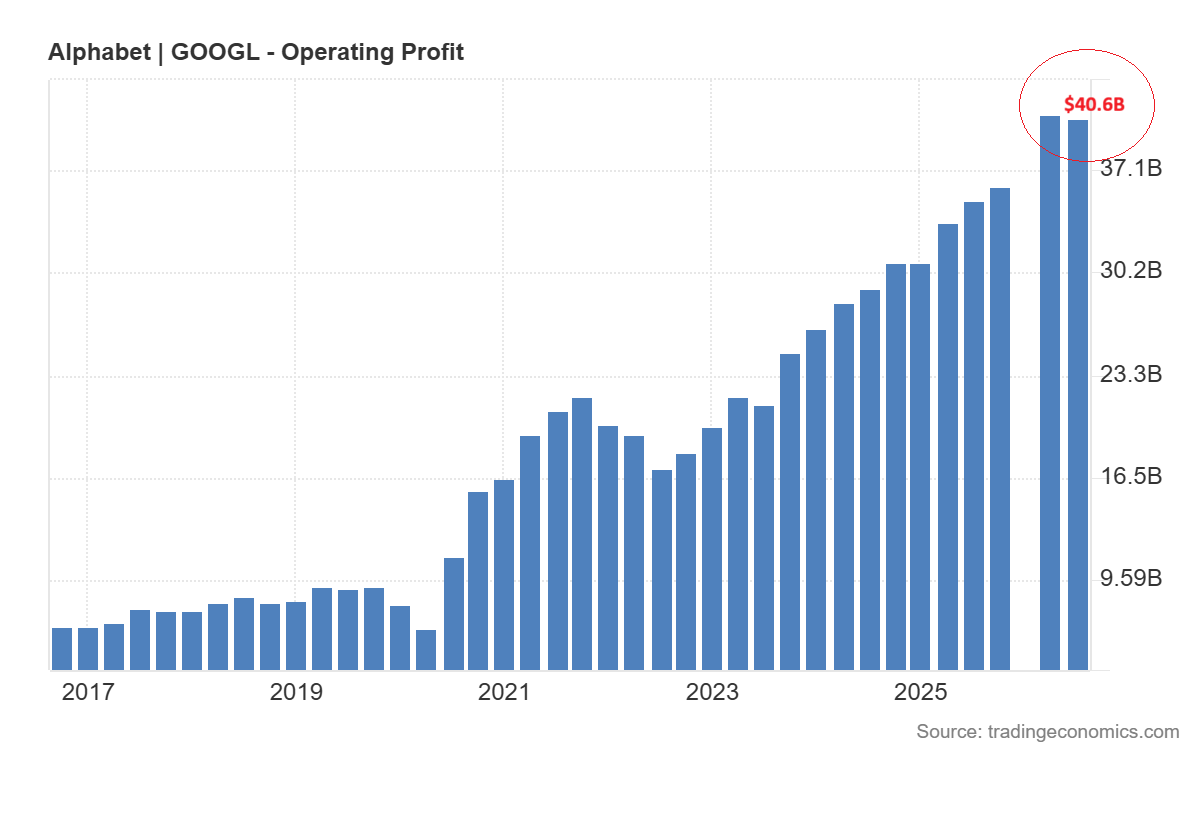
The operating profit for the company was also $45.9 billion for FYQ1 2027 which was strong compared to that in FYQ4 2026. The chart below shows consistent growth in operating profits for past ten years.
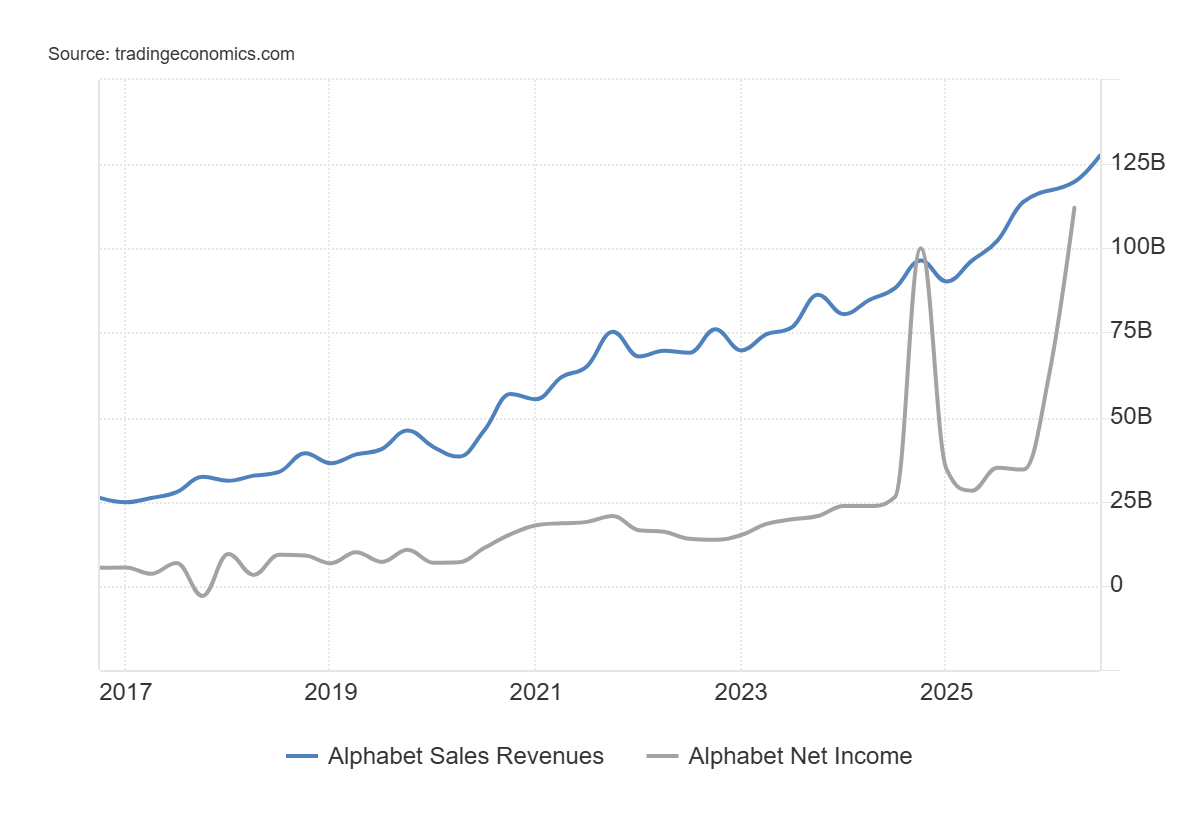
The latest results from Alphabet also show that investors remain careful about the spending on AI. Google Cloud revenue increased 103% from a year earlier. The chart below shows that the company generated $128 billion in revenue in Q3 and shows consistent increase in sales revenue.
The company spent more on new assets than cash it generated from operations which pushed free cash flow to negative $9.06 billion for the quarter. This created quick drop of over 10% in the stock price after the earnings.
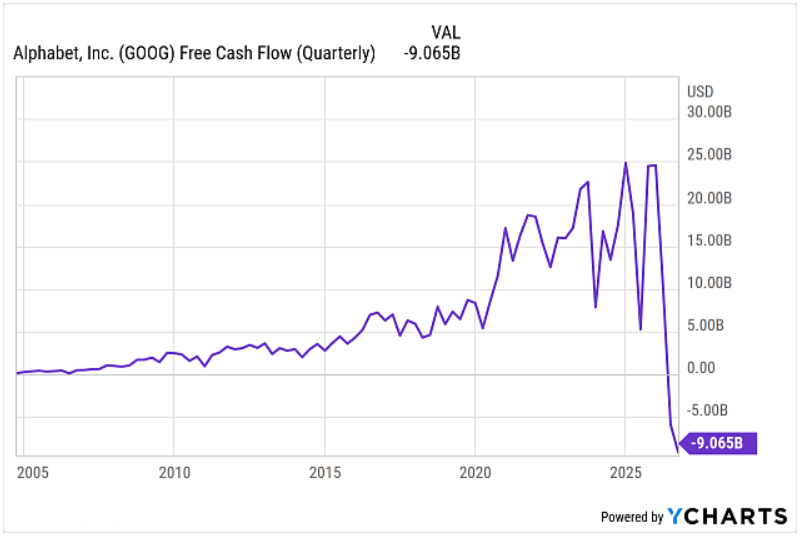
If there is continued pressure on cash flow during the next quarters, it may put pressure on the stock price of Alphabet. But the company generated strong operating profit of $40.6 billion in Q3.
The market is now watching for the results from US midterm elections and earnings from Advanced Micro Devices (AMD). Oil prices also rebounded on Tuesday due to the renewed tensions in the Middle East. If oil prices continue to rally, they may renew inflation concerns and further limit the rallies in the technology stocks.
NASDAQ 100 Price Forecast
Every new NASDAQ 100 analysis as it publishes, today's technical signal and key levels, live price — on one page.
See all NASDAQ 100 forecastsChip Stocks Could Decide Nasdaq’s Next Move
The next move in the Nasdaq index is also dependent on chip stocks. The demand for chips and networking equipment from companies such as Nvidia and Broadcom is increasing as companies are spending more on AI.
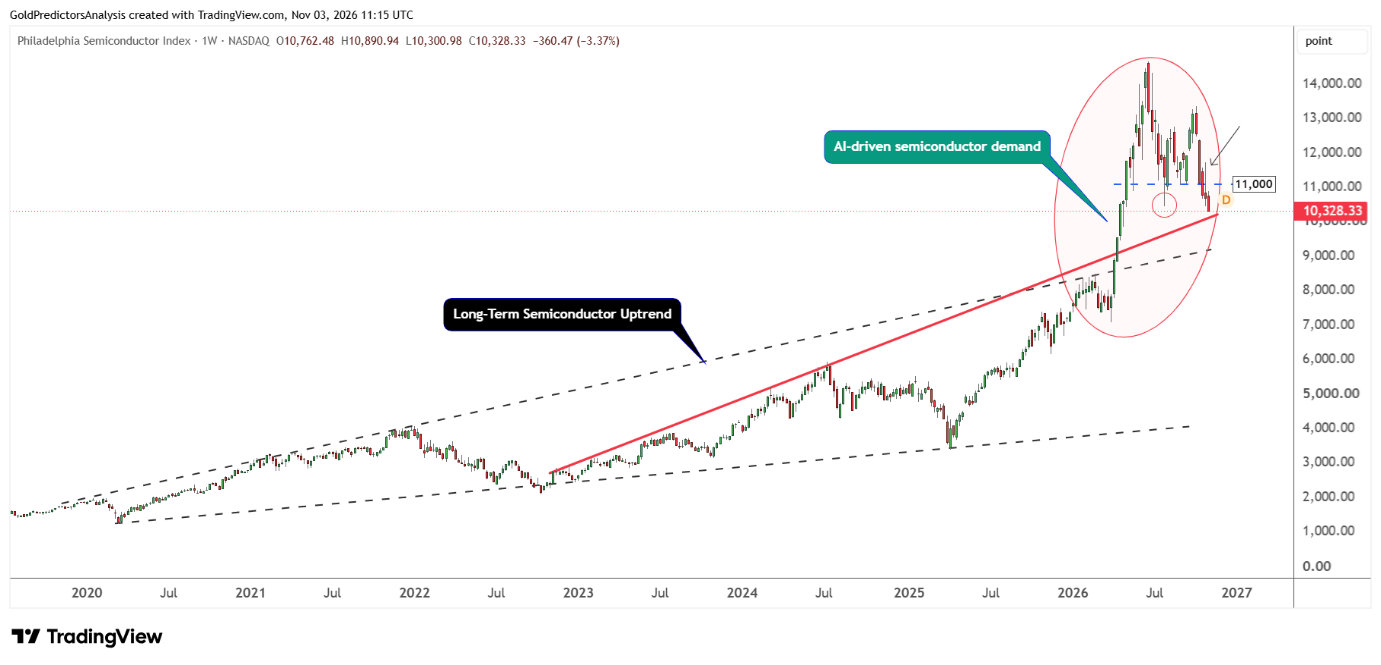
The chart below shows that the Philadelphia Semiconductor Index gained strongly in 2026 to mark record high in June 2026. However, the index dropped significantly after June toward the key support areas.
The index lost 15.36% in October and approached the red trend line at 10,000. This trend line stretches back to November 2022. A break below 10,000 will likely open the way for further drop toward the 9,200 level. But another selloff in chips may trigger drop in the index again.
The strong selling pressure in the semiconductor index suggests that the chip stocks may continue to drop further in the short term. This suggests that Nasdaq 100 may face further downside. A strong recovery above 13,200 is required to turn semiconductor index into bullish territory.
Nasdaq 100 Price Forecast: Key Support and Resistance Levels
Weekly Chart: Nasdaq 100 Tests 28,000 Support
The weekly chart for the Nasdaq 100 shows that the index produced a cup and handle formation from November 2021 to November 2023. This is a strong bullish formation. A breakout in November 2023 triggered strong surge in the index to mark a record high in October 2026 at the 31,400 level. The index has gone through multiple stages to produce new record highs.
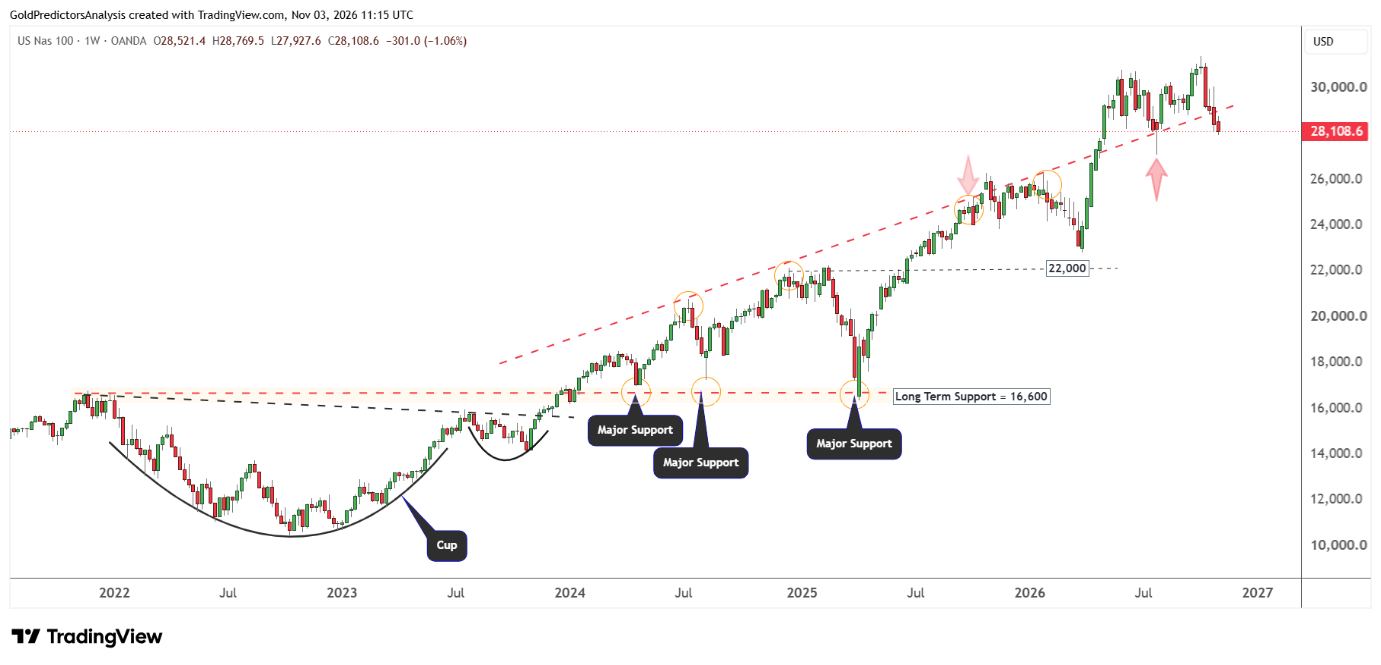
The price structure suggests that the trend for the Nasdaq 100 still remains bullish in the long term. The index has formed V-shaped recovery patterns in April 2025 and 2026 which supports a bullish view.
But the index is now correcting after marking a record high at 31,400 and remains under bearish pressure in the short term. The index has now broken the red-dotted ascending trend line at 28,900 last week and continues to attack the support of 28,000. A break below the 28,000 level will likely push the index lower towards the 26,000 area.
Daily Chart: Nasdaq 100 Breaks Below 28,800
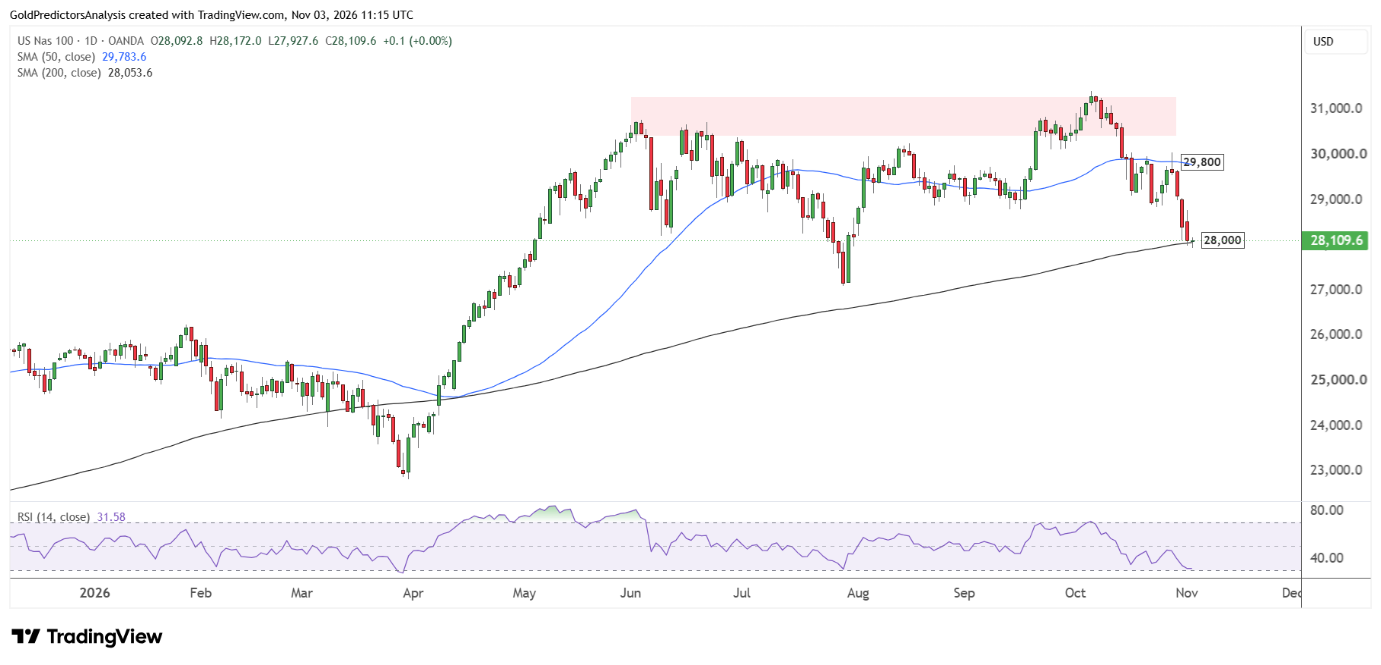
The negative price action in Nasdaq 100 is also observed on the daily chart. The chart shows that the index has broken the 50-day SMA and hit the 200-day SMA near 28,000. A break below 28,000 will likely trigger deeper correction toward highs of November 2025 near 26,000.
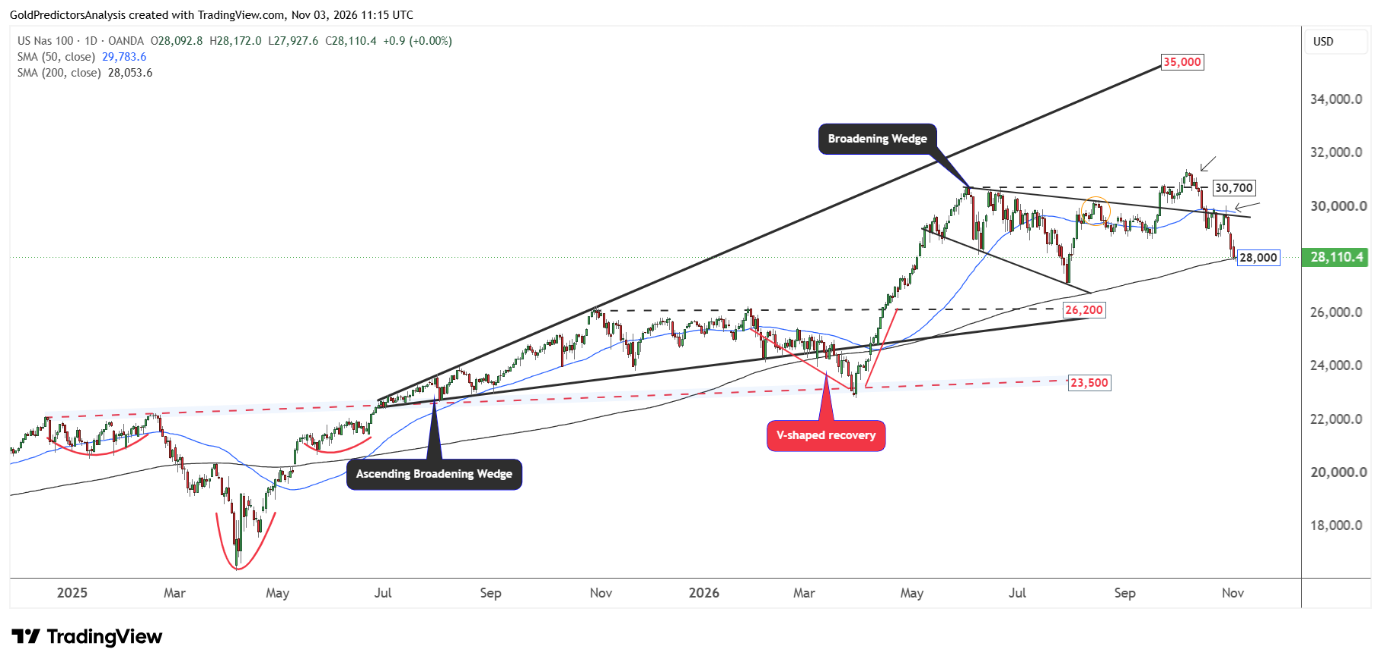
The index needs to recover above the 50-day SMA near 29,800 to open the way for further upside. A break above 29,800 will likely suggest a rally towards 31,400.
The bearish pressure in the index is also observed on another daily chart. The chart below shows that the index failed to break above the red-highlighted region at 31,400 and triggered a deeper correction. The index has already reached the support at the 200-day SMA and the RSI has reached oversold territory. This suggests that the Nasdaq 100 may rebound from this support zone. However, a weekly close below 28,000 will likely continue the bearish trend and further push lower.
What Nasdaq Needs for a Recovery
The Nasdaq 100 remains under pressure despite the support from strong demand for cloud services and growth in technology earnings. The negative free cash flow for Alphabet highlights the pressure from rising costs. In my view, strong cash flow across the largest companies may give Nasdaq strong basis for recovery.
The long-term trend for Nasdaq still remains bullish but the short-term outlook remains bearish. The important support in Nasdaq remains at 28,000 at the 200-day SMA. A clear break below this level may push the index lower towards support in the 26,000 area. On the other hand, a break above 29,800 may push Nasdaq towards the record high at the 31,400 level.