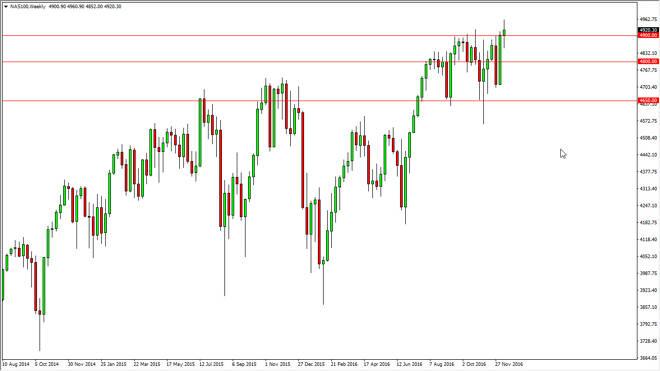
The Nasdaq 100 went back and forth over the course of the last week, as we continue to bang around the 4900 level. This is a very exhausted looking market
The Nasdaq 100 went back and forth over the course of the last week, as we continue to bang around the 4900 level. This is a very exhausted looking market at the moment, but quite frankly I think the only direction we can go over the longer term is going to be higher. If we can find support at the 4800 level below, that might be a buying opportunity. A break above the top of the range during the previous week would also be reason enough to go long but I do think that there’s going to be an issue and 5000 as it has quite a bit of psychological importance.
Chris is a proprietary trader with more than 20 years of experience across various markets, including currencies, indices and commodities. As a senior analyst at FXEmpire since the website’s early days, he offers readers advanced market perspectives to navigate today’s financial landscape with confidence.