



Alphabet and Caterpillar Set a Bearish Tone
The S&P 500 Index and Nasdaq Composite are lower Thursday, pressured by disappointing earnings reports. At 17:45 GMT, the tech-heavy Nasdaq Composite is off by 1.3%, while the broad-based S&P 500 Index is down 0.3%.
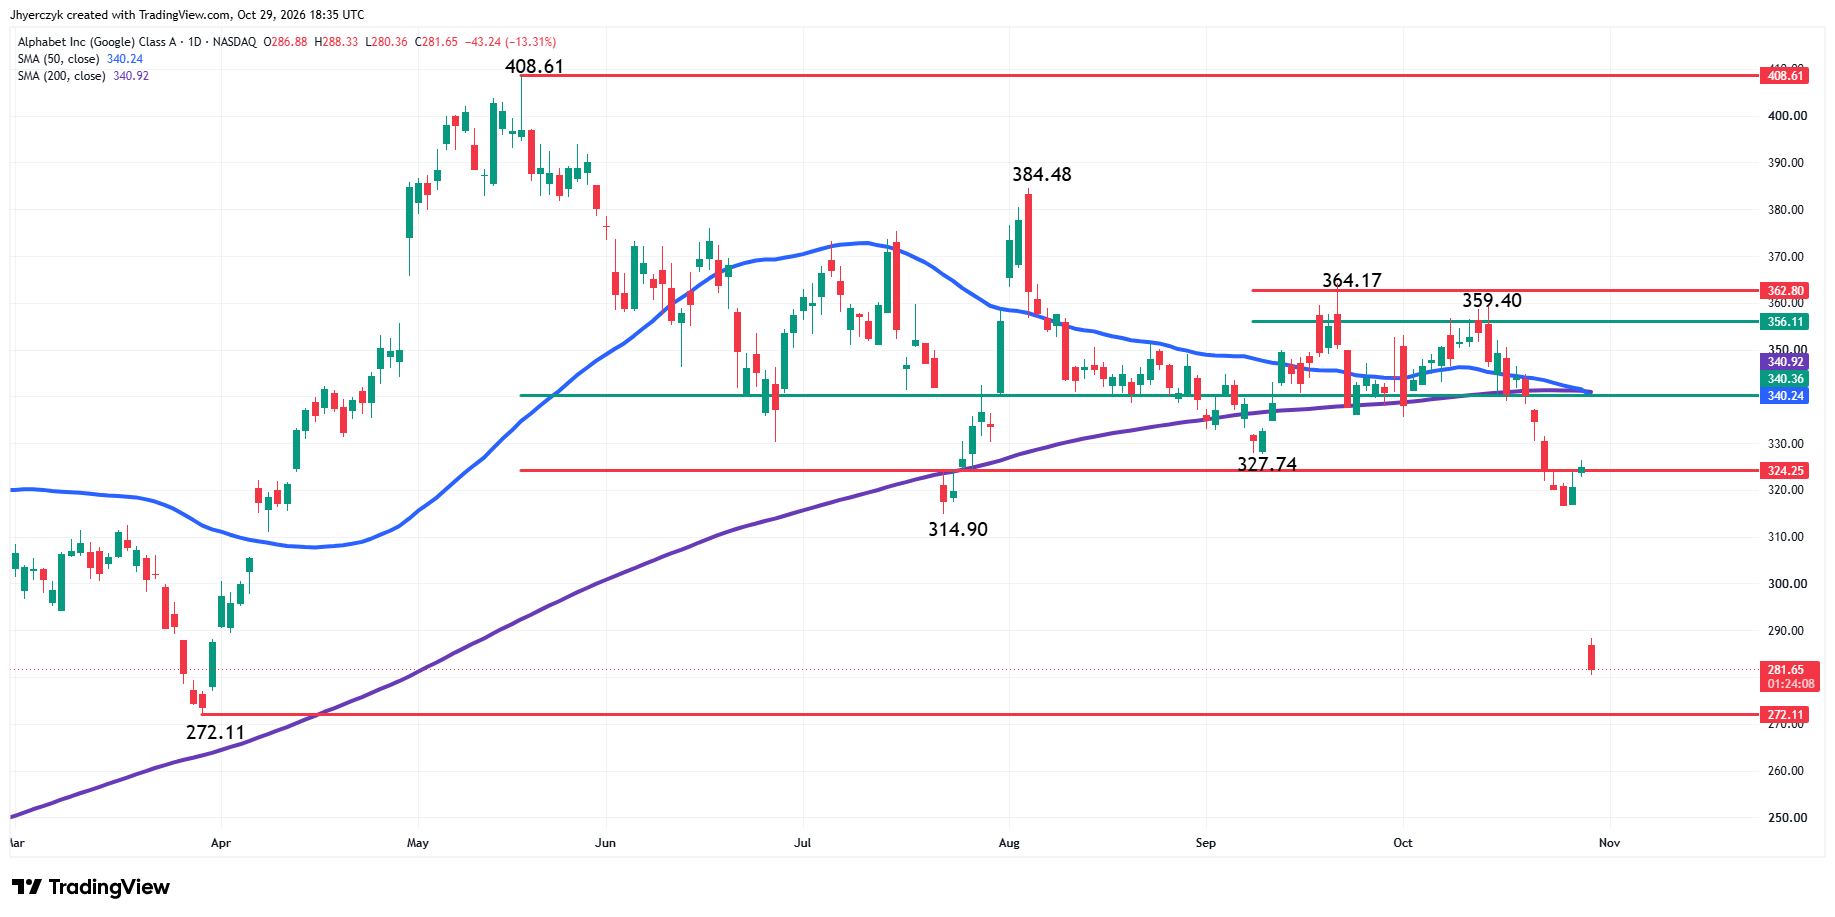
Driving most of the negative sentiment is Alphabet, which dropped over 12%. Sellers were reacting to an unexpected miss on adjusted earnings per share and revenue in the third quarter. Caterpillar also took a hit, falling nearly 8%. The company beat on revenue and earnings for the third quarter, but missed on sales for its construction industries business.
Microsoft, Neoclouds and Chip Stocks Come Under Pressure
Microsoft was also lower, giving back early gains. It rose initially after an Azure beat, but may have run into sellers reacting to the weakness in Alphabet. The weakness in Microsoft spread to the neoclouds, sending CoreWeave more than 1% lower and Nebius down by more than 3%.
Chip stocks that had carried the S&P 500 and Nasdaq Composite higher throughout the week were also lower. The iShares Semiconductor ETF (SOXX) and the Roundhill Memory ETF (DRAM) were down more than 1% and 4%, respectively.
Fed Holds Steady as December Rate Hike Expectations Build
In other news, investors showed little response to the Fed’s decision to hold rates steady, but this was likely priced in for weeks. Traders now expect the Fed to raise rates in December. The Fed said inflation “remains elevated” but added that it is also awaiting the “accumulation of more information” before taking further steps.
Daily S&P 500 Index (SPX) Technical Analysis
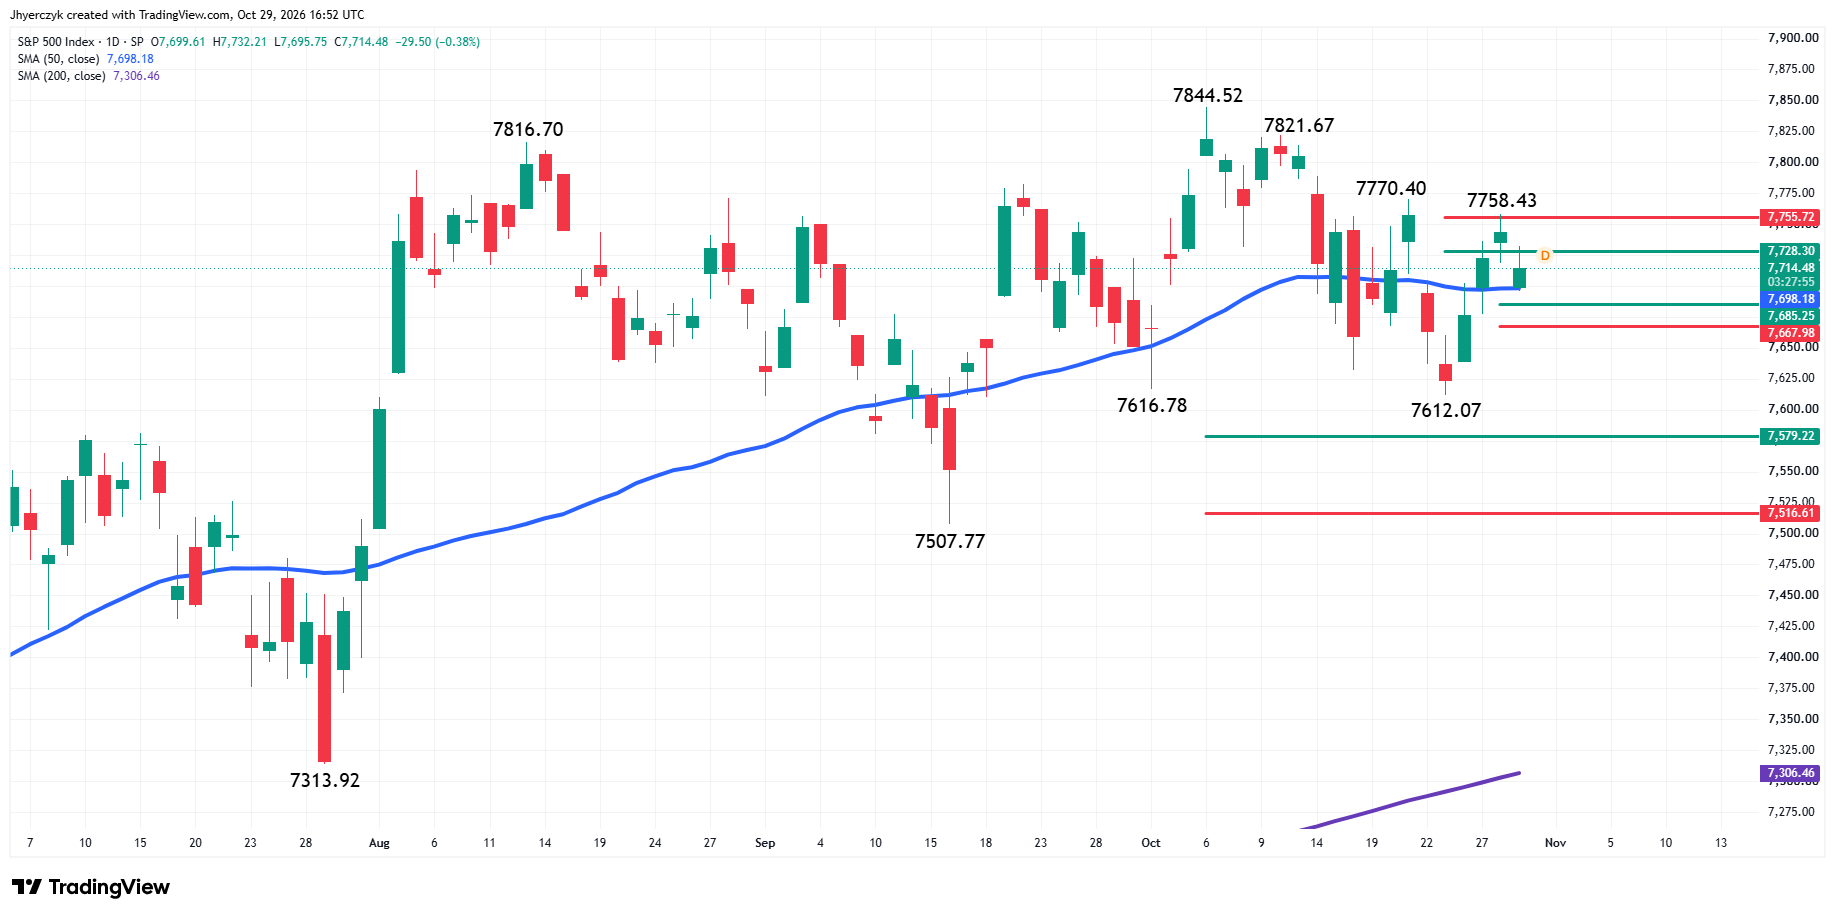
The S&P 500 Index is trading lower shortly after the midsession on Thursday. The main trend is down according to the daily swing chart. A trade through 7770.40 will change the main trend to up. Taking out 7612.07 will signal a resumption of the downtrend.
Dow Jones Price Forecast
Every new Dow Jones analysis as it publishes, today's technical signal and key levels, live price — on one page.
See all Dow Jones forecastsThe minor trend is also down. A trade through 7758.43 will change the minor trend to up. This may even shift momentum enough to take out the main top at 7770.40.
Traders are also testing the 50-day moving average at 7698.24. This indicator has been acting more like a pivot the last two weeks rather than a trend indicator. This may be part of the reason why the trade has been so choppy.
On the upside, retracement zone resistance is 7728.30 to 7755.72. On the downside, retracement zone support is 7685.25 to 7667.98. The tight separation of these two zones is also indicative of a market trying to find direction.
Trader reaction to the 50-day moving average at 7698.24 is likely to set the tone today into the close.
Holding above the 50-day moving average will indicate the presence of buyers. If they can create enough upside momentum then look for an attempt to overtake the retracement zone at 7728.30 to 7755.72. This area stopped the rally on Wednesday. If they can clear the retracement zone then I think the minor top at 7758.43 and the main top at 7770.40 could fall quickly. Only then will the index have a clean shot at 7821.67 and the record high at 7844.52.
A sustained move under the 50-day moving average will be a sign of weakness. This could lead to a quick test of the minor retracement zone at 7685.25 to 7667.98. If this fails then sellers could have a clean shot at 7612.07, followed by the major retracement zone at 7579.22 to 7516.61.
Daily Nasdaq Composite Index (IXIC) Technical Analysis
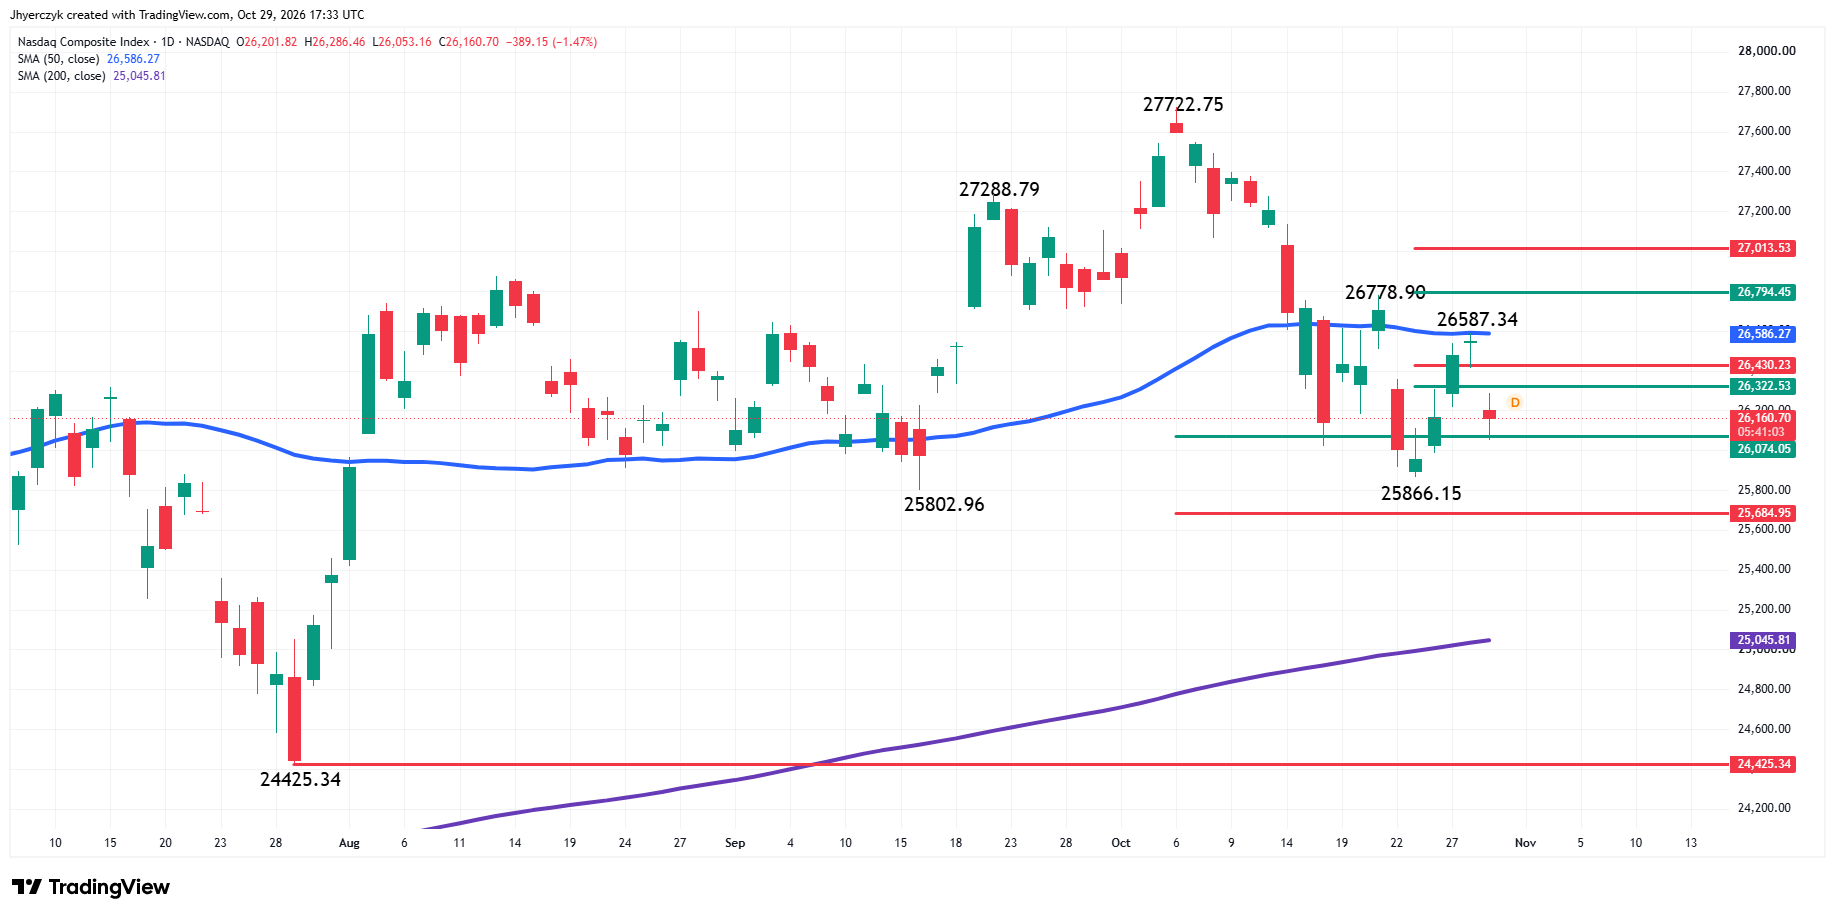
The Nasdaq Composite Index is also under pressure as we enter the last half of the trading session. The main trend is down according to the daily swing chart. A trade through 26778.90 will change the main trend to up. Taking out the swing bottom at 25866.15 will reaffirm the downtrend.
The minor trend is down. A trade through 26587.34 will change the minor trend to up. This could shift momentum to the upside.
Since crossing to the weak side of the 50-day moving average on October 15, the index has been acting like resistance. Yesterday, it essentially stopped the rally at 26587.34. Today, the 50-day moving average is at 26586.85.
Retracement zone resistance is 26794.45 to 27013.53. Today, the market crossed to the weak side of a minor retracement zone at 26322.53 to 26430.23, making it resistance.
The long-term range is 24425.34 to 27722.75. Its retracement zone is 26074.05 to 25684.95. This zone stopped the selling at 25866.15, fueling this week’s rally to 26587.34. Today’s low at 26053.16 tested the upper or 50% level at 26074.05.
Lower tops and lower bottoms and the rejection at the 50-day moving average have me leaning to the downside into the close. My outlook will weaken if the index regains the minor 50% level at 26322.53. It will strengthen if the long-term 50% level at 26074.05 fails as support.
I also think that continued trade under the 50-day moving average could eventually lead to a test of the 200-day moving average at 25045.78. Sellers just have to clear the long-term 61.8% level at 25684.95 in order to achieve this.
More Information in our Economic Calendar.