



Hot CPI and Waller Comments Reverse Monday’s Rally
The major U.S. stock indices are lower on Tuesday, led by a 0.87% drop in the tech-heavy Nasdaq Composite and a 0.67% decline in the benchmark S&P 500 Index.
After Monday’s stellar rally, sellers came back earlier today after a top Federal Reserve member indicated he thinks a December rate hike is likely, even suggesting a larger 50-basis-point increase next month.
“While the precise timing of the hikes doesn’t matter, ensuring that the promised hikes are implemented in a reasonable period of time does,” Fed Governor Christopher Waller said.
The stock market was hit with more bad news a little later after October consumer inflation came in hotter than expected. Both headline and core inflation data were higher than economist forecasts.
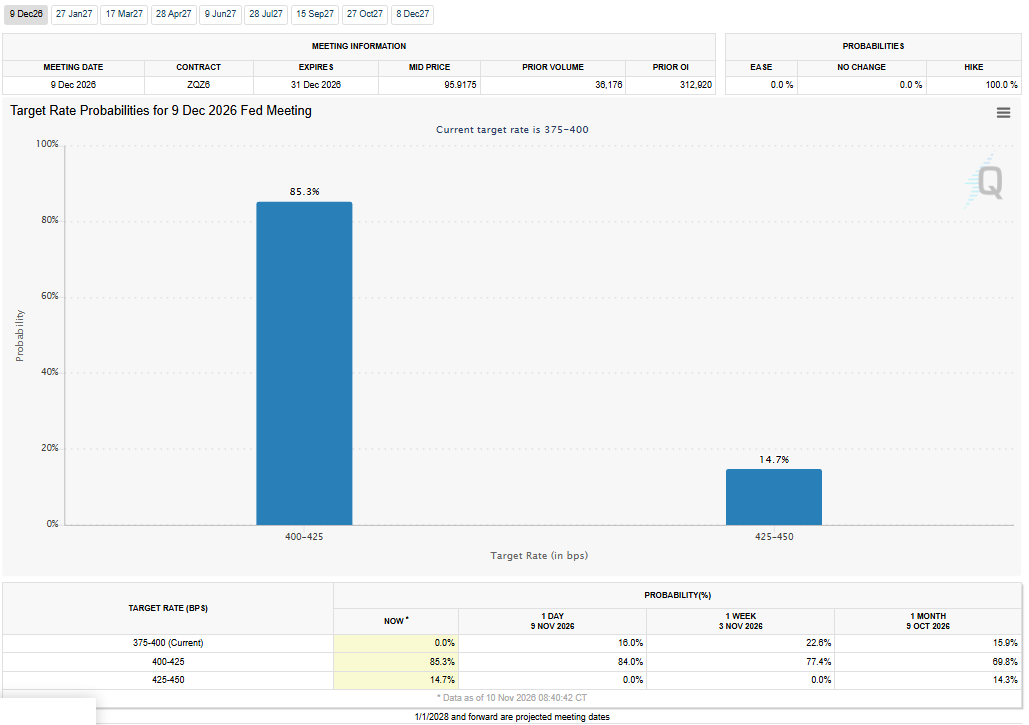
The combination of Waller’s hawkish comment and the CPI data drove the probability of a Fed rate hike in December to 100%.
The news encouraged some investors to sell shares of some companies that had rallied the previous two sessions, but so far in the session, last week’s lows are holding. Helping to keep the market in check so far today is Advanced Micro Devices, which jumped 5%, and Broadcom, which gained 3%. Marvell Technology added more than 1%. Nvidia continued to weaken, falling over 3% as investors continued to sell in the wake of reports that CEO Jensen Huang was targeted by a Chinese intelligence effort.
On Monday, the week started with the major indexes posting their best one-day performance since April. However, there was no follow-through to the upside on Tuesday, suggesting traders still face headwinds due to the fallout from the Democrats’ big victories in last week’s midterm elections. AI investors are still worried about the potential for a slowdown in data center buildouts.
Daily S&P 500 Index (SPX) Technical Analysis
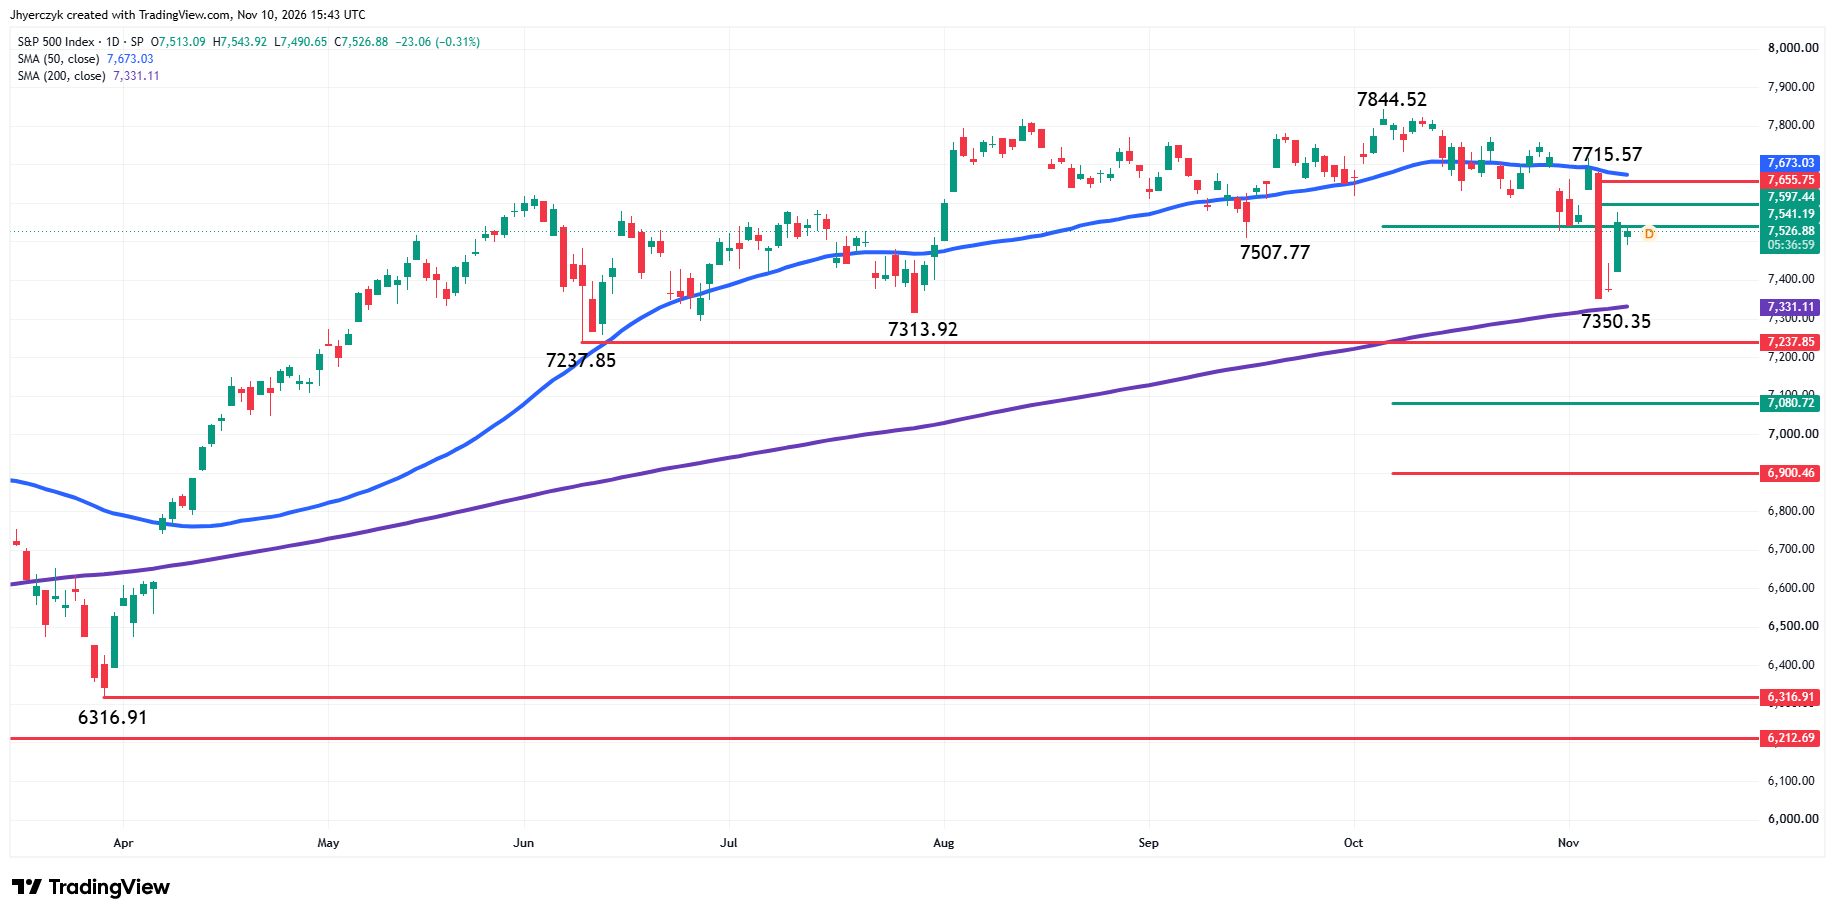
The S&P 500 Index is lower early Tuesday. The main trend is down according to the daily swing chart. A trade through 7715.57 will change the main trend to up. A move through 7350.35 will signal a resumption of the downtrend.
The short-term range is 7844.52 to 7350.35. Its retracement zone at 7597.44 to 7655.75 is a potential resistance area.
The intermediate range is 7237.85 to 7844.52. Its 50% level at 7541.19 is acting like resistance shortly after the opening.
The long-term range is 6316.91 to 7844.52. Its retracement zone at 7080.72 to 6900.46 is a major downside target area.
The 50-day moving average at 7673.05 is resistance and the 200-day moving average at 7331.10 is support. Both are also potential trigger points for an acceleration.
Dow Jones Price Forecast
Every new Dow Jones analysis as it publishes, today's technical signal and key levels, live price — on one page.
See all Dow Jones forecastsDaily Nasdaq Composite Index (IXIC) Technical Analysis
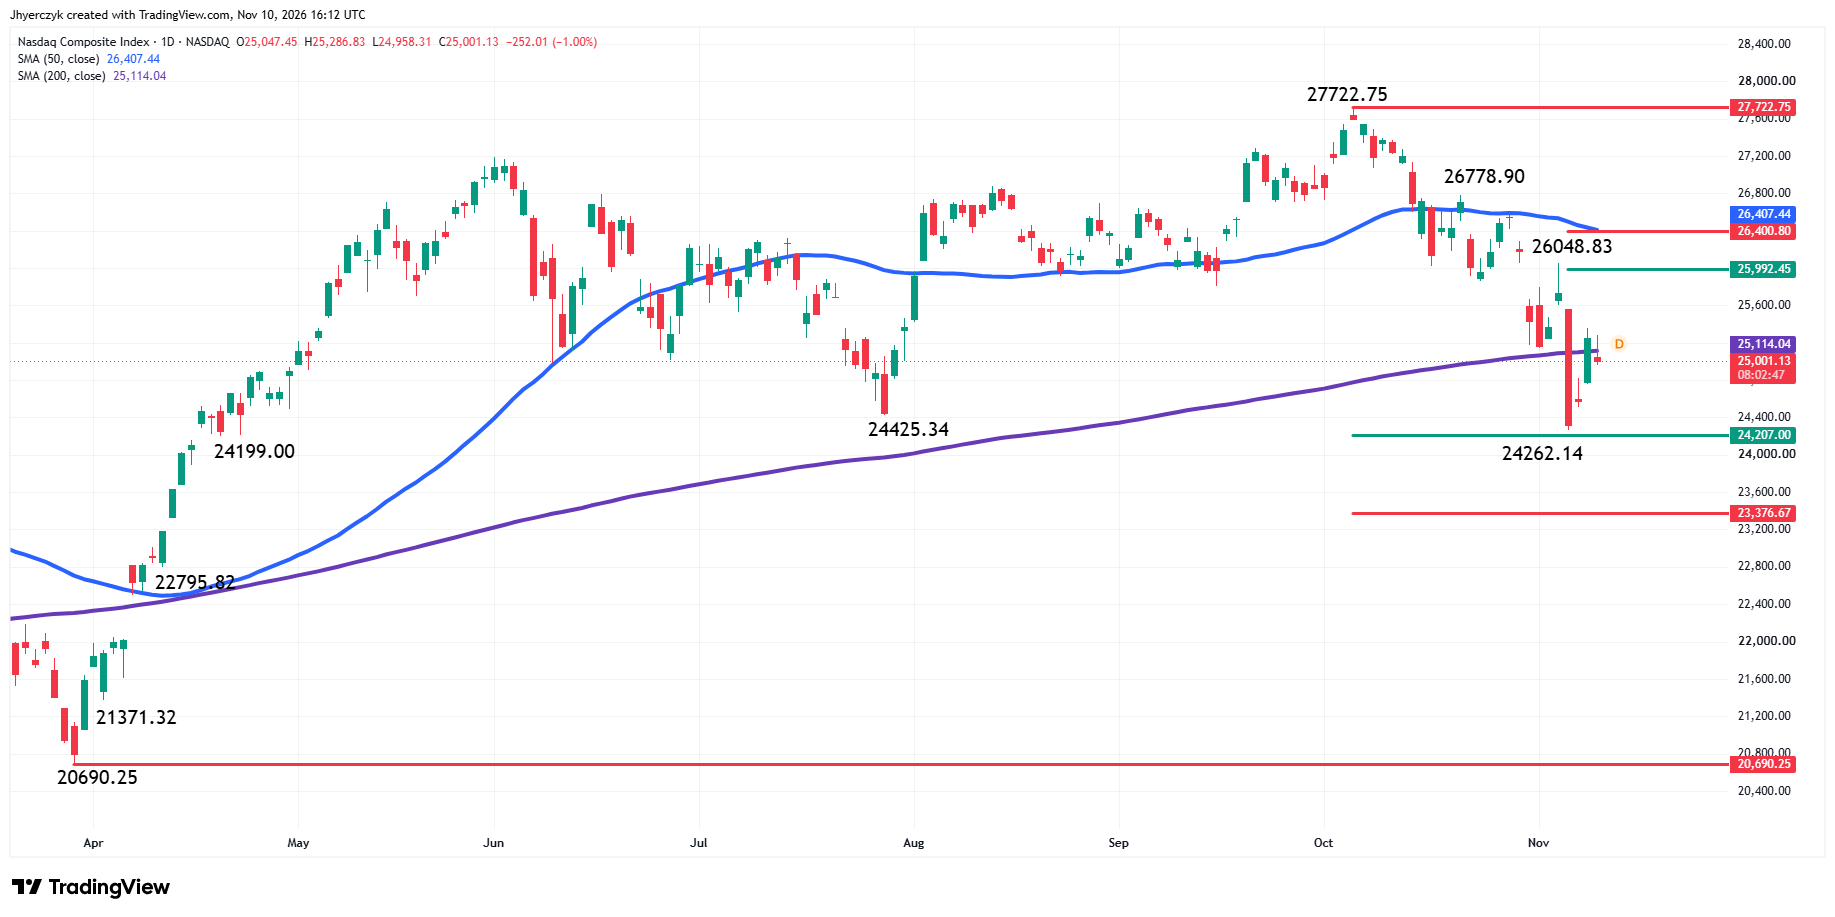
The Nasdaq Composite Index is sharply lower on Tuesday after failing to sustain yesterday’s close over the 200-day moving average at 25114.04. This indicator is acting like resistance again.
The main trend is down according to the daily swing chart. A trade through 26048.83 will change the main trend to up. Taking out 24262.14 will signal a resumption of the downtrend.
The short-term range is 27722.75 to 24262.14. Its retracement zone at 25992.45 to 26400.80 is resistance. The 50-day moving average at 26407.44 is additional resistance. It forms a tight resistance cluster with the 61.8% level at 26400.80.
The long-term range is 20690.25 to 27722.75. Its 50% to 61.8% retracement zone at 24207.00 to 23376.67 is the primary downside target of this current downswing. Watch for a technical bounce on the first test, but if 23376.67 fails, look for the start of a possible steep decline.
What to Watch
Daily S&P 500 Index (SPX)
The downtrend on the swing chart and the trade below the 50-day moving average at 7673.05 has me cautiously bearish. My primary concern is the inability to take out the 200-day moving average at 7331.10.
Overcoming the intermediate 50% level at 7541.19 will weaken my bias. Crossing to the strong side of the 50-day moving average will also mean that traders have overcome the short-term retracement zone at 7597.44 to 7655.75.
Sellers are going to have to drive the market away from 7541.19 to better support my downside bias. If they can accomplish this then a test of the 200-day moving average is the next move. Although there could be a technical bounce on the first test, a failure to hold it could trigger a sharp break into the long-term retracement zone at 7080.72 to 6900.46. That is the key downside objective for this swing.
Daily Nasdaq Composite Index (IXIC)
The 200-day moving average at 25114.04 is controlling my downside bias. As long as the market stays under this indicator the odds of an extended break into the retracement zone at 24207.00 to 23376.67 are likely to increase.
My outlook will shift to the upside if buyers can overcome the 200-day moving average with conviction. This could create the momentum needed to drive the Nasdaq Composite Index into the retracement zone at 25992.45 to 26400.80 and the 50-day moving average at 26407.44.
More Information in our Economic Calendar.