



Hawkish Fed Signals and AI Competition Pressure Stocks
All three major stock indexes are under pressure as we head into the last two hours of trading. The market has been under pressure since the opening following hawkish comments from Fed Governor Christopher Waller, suggesting the possibility of a 50-basis point rate hike by the Fed in December. Additional pressure is coming from the hotter-than-expected consumer inflation report, which helped drive the probability of a Fed rate hike to 100%, according to the FedWatch tool.
Another sell-off in Nvidia is weighing on all three indexes. Nvidia is down another 6% on Tuesday amid reports that CEO Jensen Huang was targeted by a foreign intelligence effort.
Microsoft, which also is a constituent of the three major indexes, is down over 3%. Traders are reacting to Anthropic’s announced slate of new workplace tools for Claude. Investors see this as a possible threat to Microsoft’s Office, which could have a negative impact on company earnings.
Daily Dow Jones Industrial Average (DJI) Technical Analysis
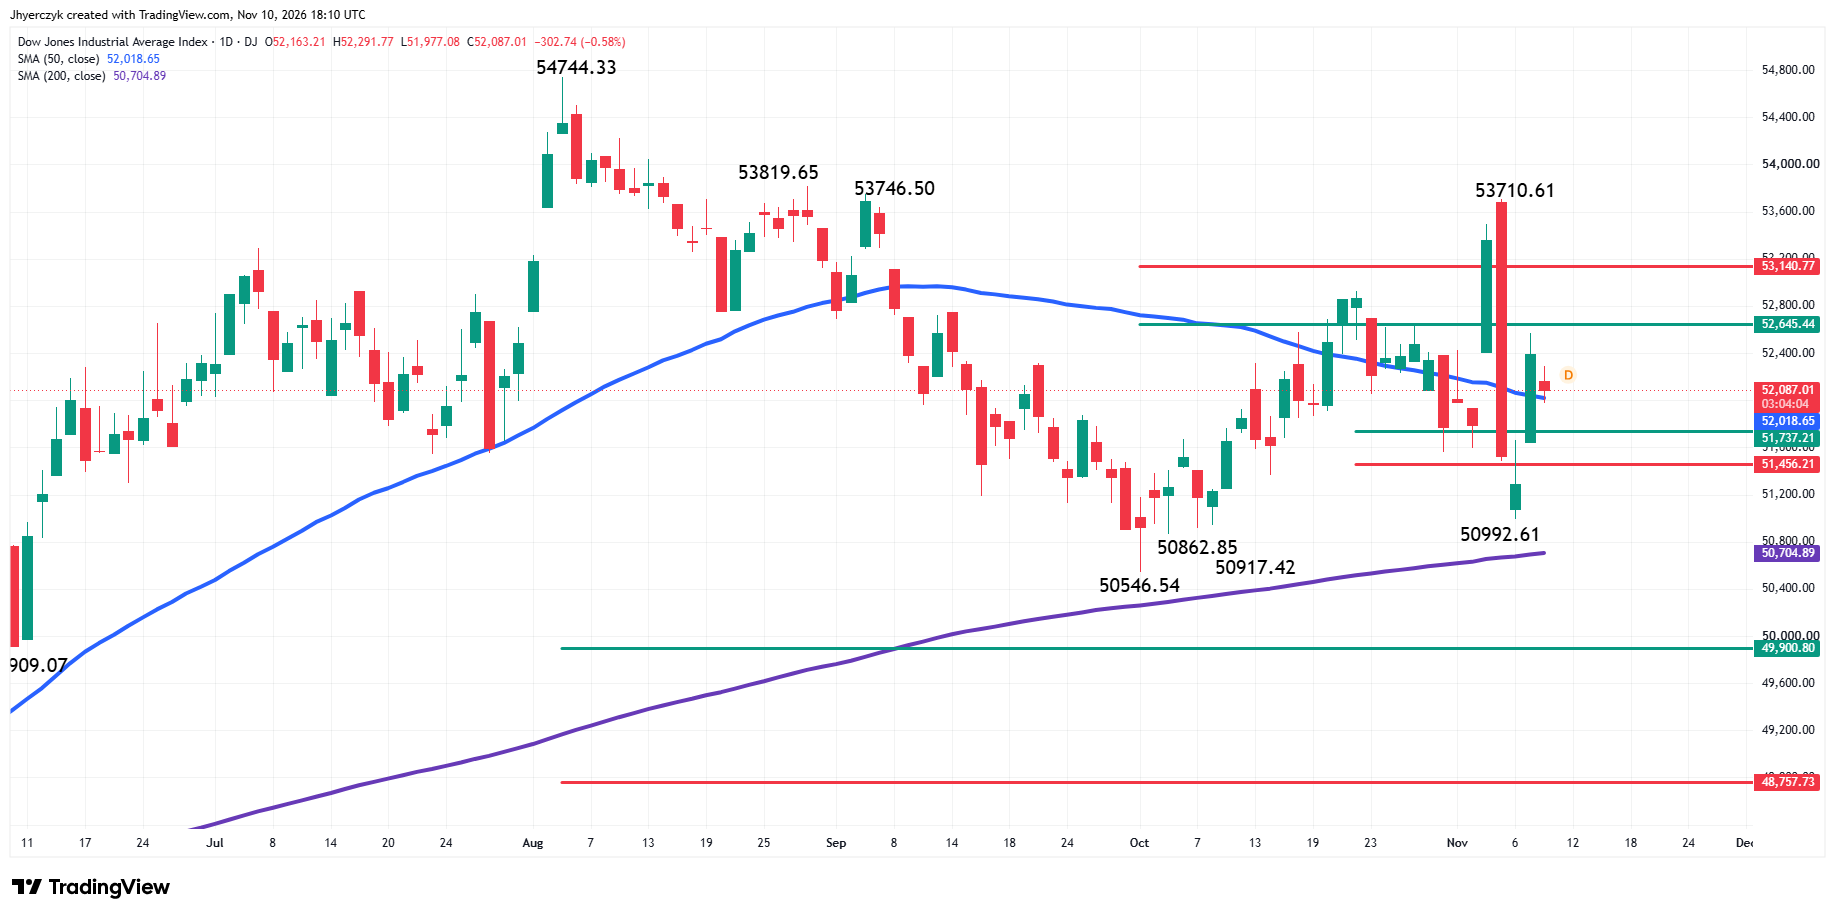
The Dow Jones Industrial Average is lower on Tuesday as it continues to chop around the 50-day moving average at 52017.64. The price action reflects a mixed picture with bullish traders trying to support a move on the strong side of the indicator and bearish traders trying to force the market through it.
The 200-day moving average remains the major support at 50704.69 after holding near tests at 50546.54 on October 1 and 50992.61 on November 6.
The main trend is down according to the daily swing chart. A trade through 53710.61 will change the main trend to up. A successful change in trend will then target swing tops at 53746.50 and 53819.65. The major upside target is the all-time high at 54744.33.
The downtrend will resume on a trade through Friday’s low at 50992.61. Traders will then shift their focus to the minor bottoms at 50917.42 and 50862.85. The main bottom at 50546.54 could be the trigger point for an acceleration to the downside.
The intermediate retracement zone at 52645.44 to 53140.77 is the nearest resistance. Last Thursday, the Dow broke out to the bullish side of this area, but it failed to hold triggering a sharp break through the short-term retracement zone at 51737.21 to 51456.21 on Friday. Monday’s rally put the Dow back on the bullish side of the short-term retracement zone, making it support.
The long-term retracement zone at 49900.80 to 48757.73 will become the major downside target if sellers can take out the 200-day moving average.
Although the main trend is down according to the daily swing chart, my bias will remain to the upside as long as the 50-day moving average at 52017.64 holds as support. This indicator has been acting like a pivot over the past week.
The price action over the past week also indicates that traders are selling rallies into resistance like the retracement zone at 52645.44 to 53140.77 and buying dips under or at the retracement zone at 51737.21 to 51456.21. This type of price action indicates more reactive trading rather than trend trading.
Until the trend establishes itself with conviction, the Dow could remain choppy with the two-sided trade represented by the selling of rallies and the buying of dips. Hopefully, trader reaction to the 50-day moving average will offer more clarity and set the near-term tone.
Daily Nasdaq Composite (IXIC) Technical Analysis
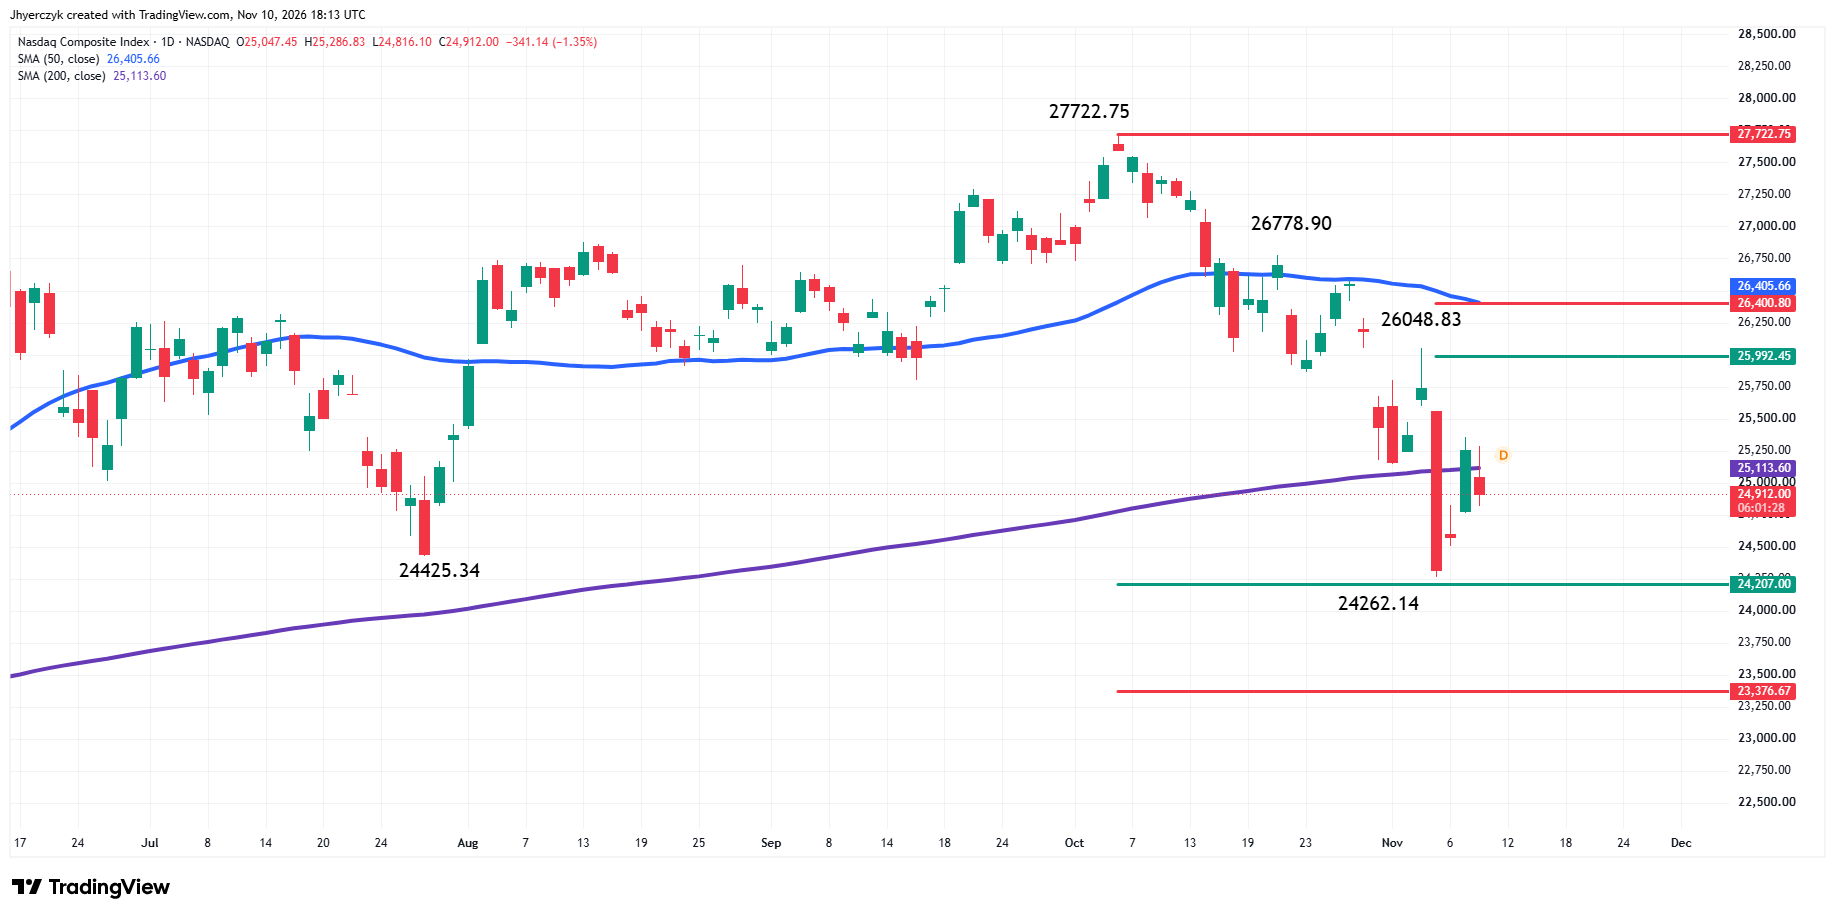
The key indicator to watch into the close on Tuesday is the 200-day moving average at 25113.60. Look for the bearish tone to continue on a sustained move under the 200-day moving average. This could put the minor pivot at 24808.22 in play.
A sustained break under 24808.22 will indicate the selling pressure is getting stronger. This could extend the break into the bottom at 24262.14 and the long-term retracement zone at 24207.00 to 23376.67.
Holding a test of the pivot at 24808.22 will signal the return of buyers. Buyers could then challenge the 200-day moving average at 25113.60 again, indicating potential upside momentum.
As long as the Nasdaq Composite remains under the 200-day moving average my bias will remain to the downside.
Daily S&P 500 Index (SPX) Technical Analysis
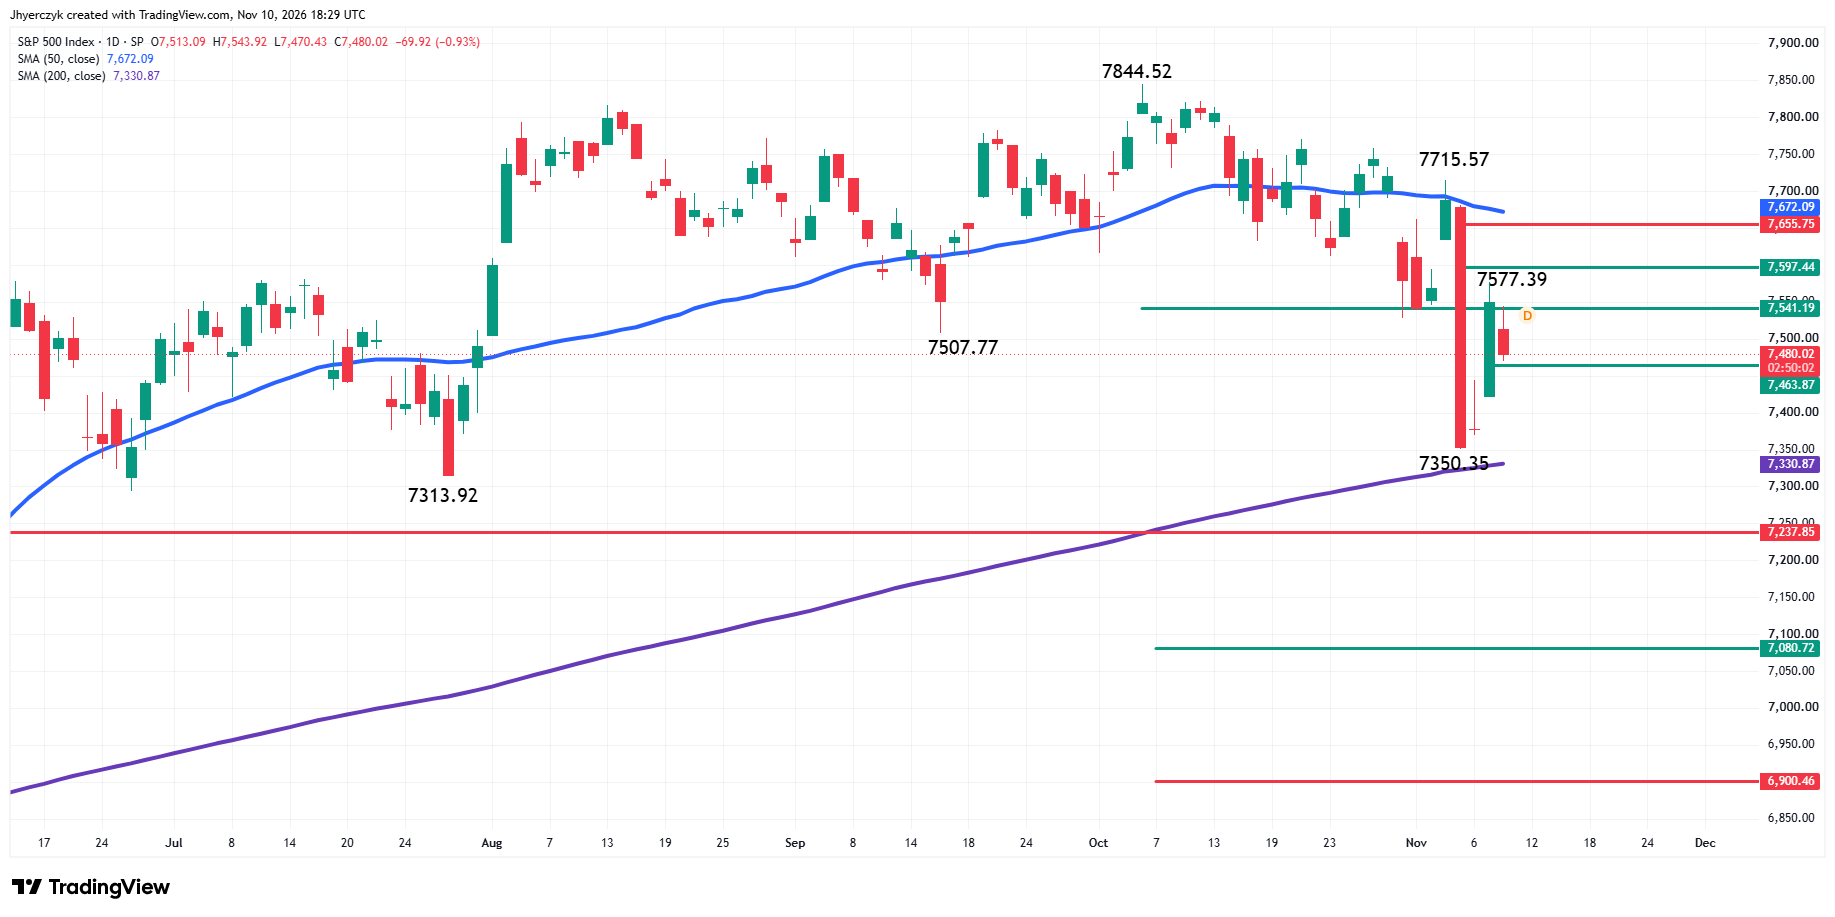
My bias into the close is to the downside as long as the S&P 500 Index stays below the intermediate 50% level at 7541.19. Taking out the minor pivot at 7463.87 will strengthen my bias and set up the possibility of an extended break into the 200-day moving average at 7330.88.
A late session breakout over 7541.19 will shift my outlook to the upside but gains could be limited by the short-term retracement zone at 7597.44 to 7655.75, followed by the 50-day moving average at 7672.12.
More Information in our Economic Calendar.