



Oil and Natural Gas News: Gulf Supply Recovery Meets US Inventory Draws
December WTI trades near $86.85 per barrel, January Brent near $93.83 per barrel and December natural gas near $2.939 per MMBtu. Oil remains under pressure as traders weigh recovering Gulf supplies against tighter US inventories. Natural gas faces a different balance: mild weather could restrain heating demand, with Thursday’s storage report providing the next test.
WTI: Crude and Fuel Inventories Fall
US commercial crude stocks, excluding the Strategic Petroleum Reserve, fell by 865,000 barrels to 409.8mn barrels in the week ended October 30. The EIA report puts inventories 4% below their five-year seasonal average. Distillate stocks, which include diesel and heating oil, also fell by 3.6mn barrels and stood 13% below average. Those draws point to a tighter domestic inventory position even as traders reassess international supply risks.
Brent: Supply Recovery Still Carries Uncertainty
Reuters’ Thursday reporting points to recovering Gulf shipments and expectations that the US midterm results could encourage Iran diplomacy. It cites JPMorgan’s estimate of a 1.4mn-barrel-per-day global surplus in October. That is the bank’s assessment, rather than a confirmed official balance. Export estimates also differ by coverage and timing, so describing all regional flows as back to normal would overstate the evidence. Diplomatic expectations continue to weigh on oil, but they do not establish that a settlement has been reached.
Meanwhile, seven OPEC+ producers agreed on November 1 to maintain September 2026 required production levels for December. The OPEC statement concerns production targets; actual output and exports still determine how much supply reaches buyers. That distinction remains central to the supply outlook.
Natural Gas: Mild Weather Keeps Storage in Focus
NOAA’s November 4 weather outlook favors above-normal temperatures across much of the contiguous US during November 12 to 18. That could limit heating demand as the winter season approaches. The forecast describes probabilities, so changes in the next weather updates could still alter the demand picture.
Natural Gas Price Forecast
Every new Natural Gas analysis as it publishes, today's technical signal and key levels, live price — on one page.
See all Natural Gas forecastsThe latest EIA storage report available ahead of Thursday’s release showed 3,724bn cubic feet in underground storage for the week ended October 23, 1% above the five-year average. Stocks increased by 80bn cubic feet that week. The November 5 report will cover the subsequent week; expectations for a wider surplus remain forecasts until those figures are published.
Natural Gas Technical Analysis: $2.927 Holds as Recovery Targets $3.001
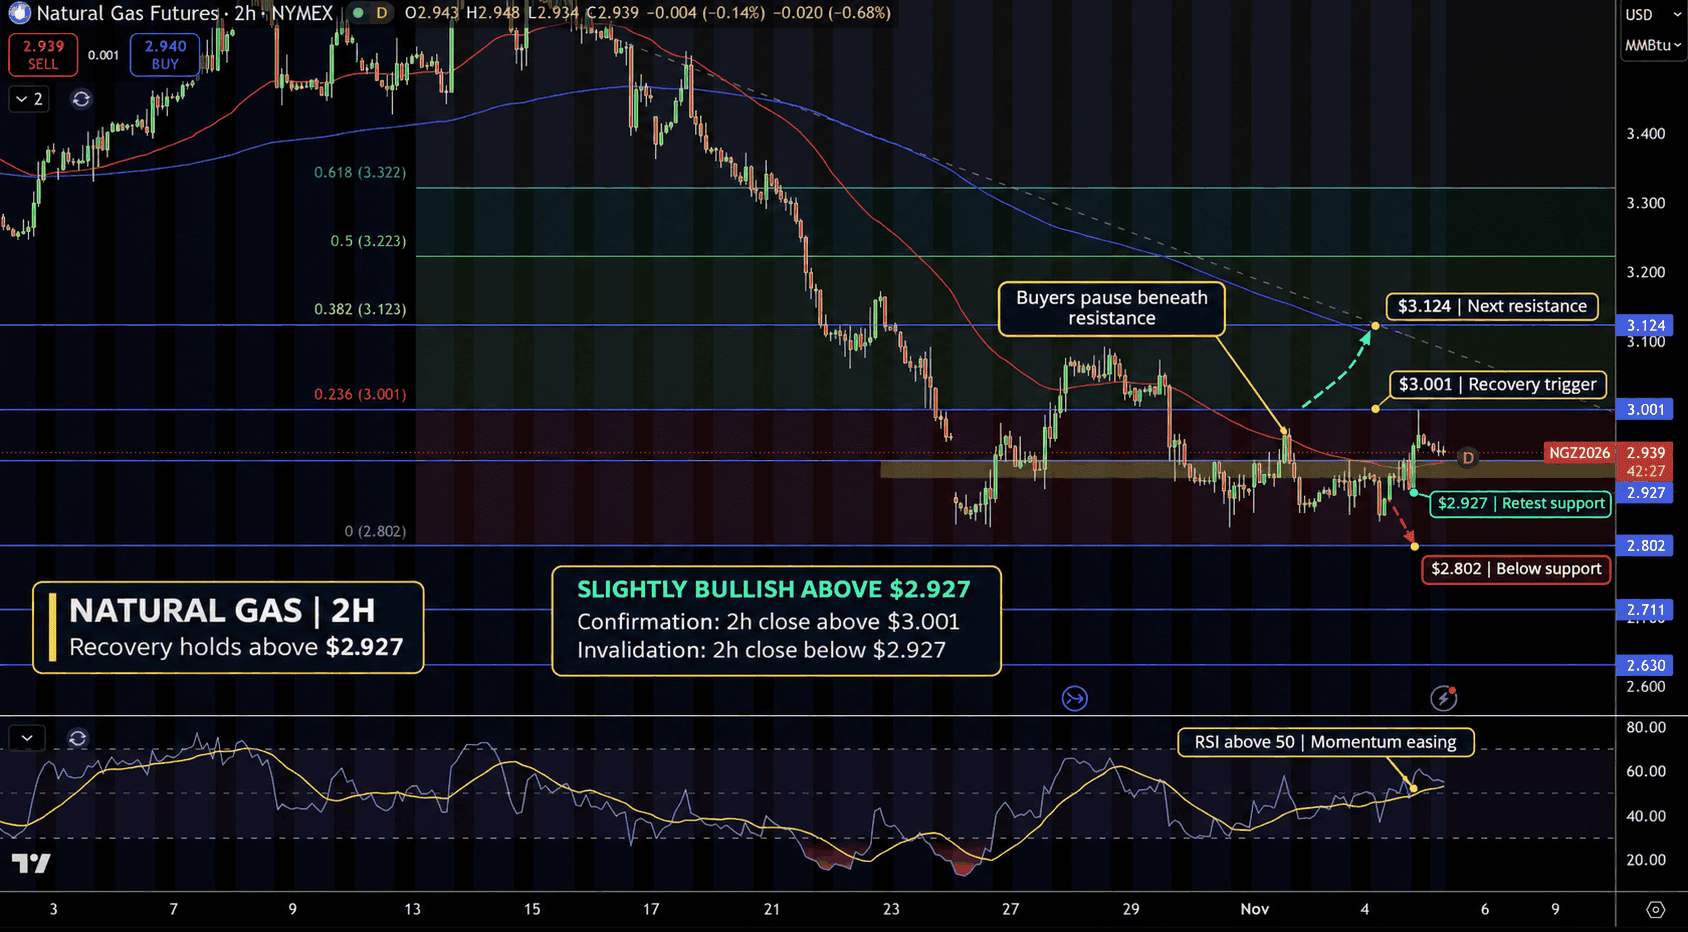
December natural gas futures trade near $2.939/MMBtu, or per million British thermal units, on the two-hour NYMEX chart. The rebound has reclaimed $2.927 and the red moving average, which tracks average prices over time. Small recent candles suggest buyers are pausing, while the longer moving average and descending trendline remain overhead.
Resistance, where sellers may return, stands at $3.001, followed by $3.124. Support, where buyers may step in, is $2.927, then $2.802. RSI, a 0 to 100 gauge of buying and selling strength, remains above 50 but has eased. I lean slightly bullish above $2.927 and favor a successful support retest. A two-hour close above $3.001 would strengthen the recovery; a close below $2.927 would invalidate the immediate bullish setup.
WTI Crude Oil Technical Analysis: Channel Breakdown Exposes $85.17
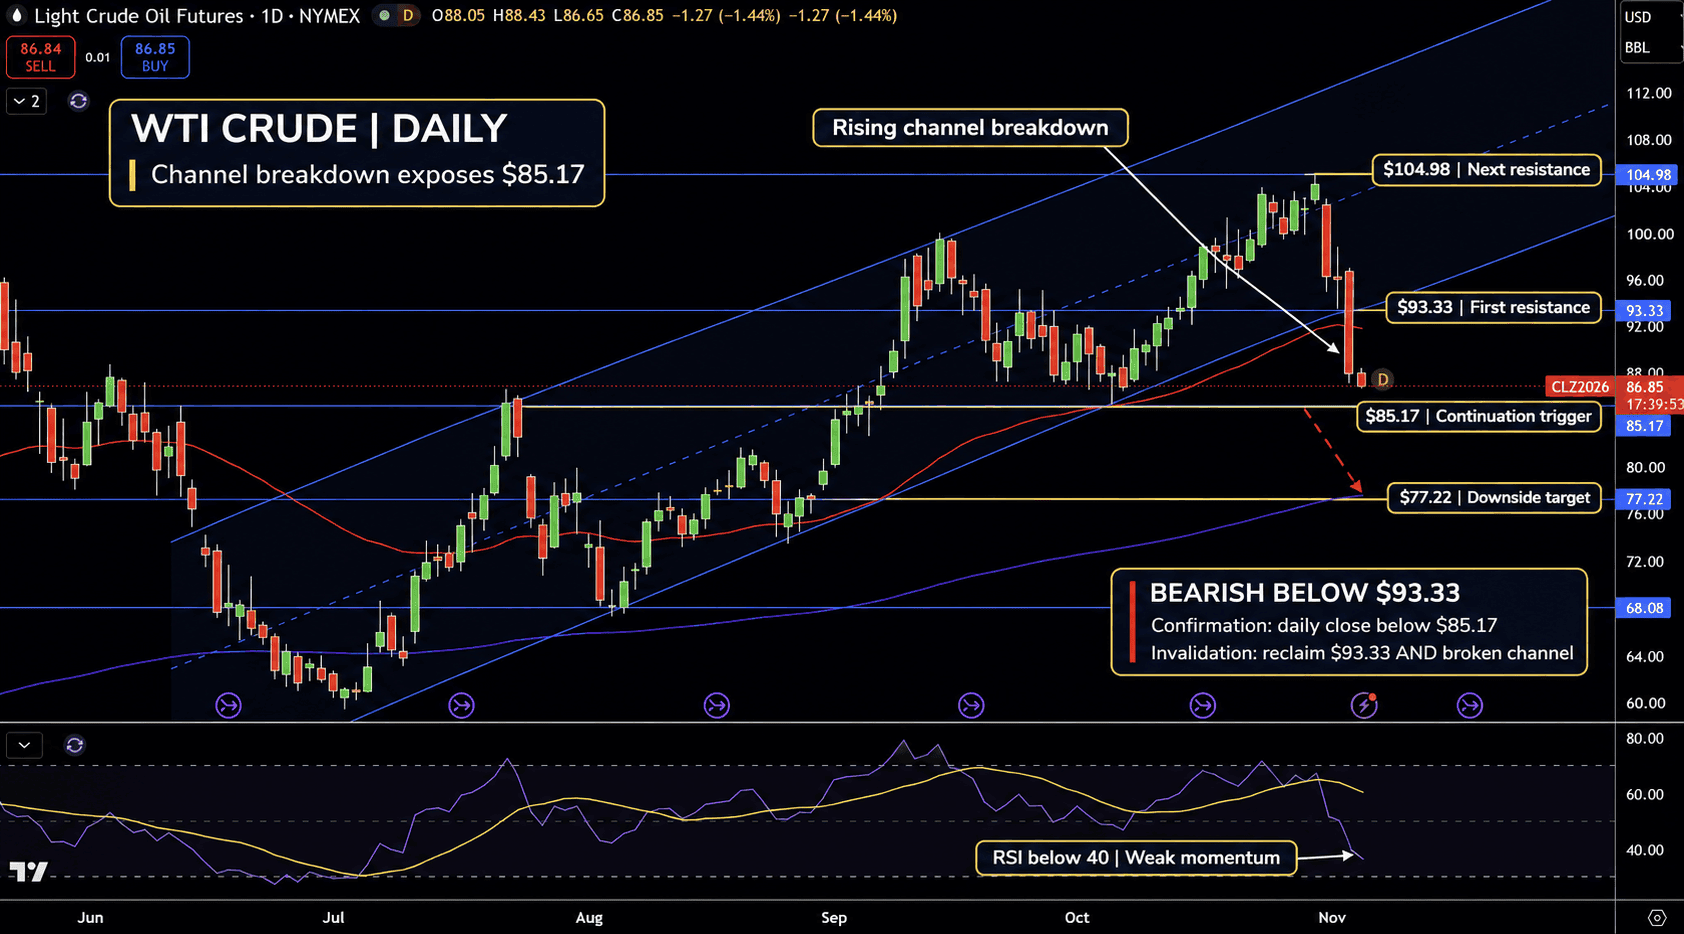
December WTI futures trade near $86.85 per barrel on the daily NYMEX chart. Price has broken the rising channel, two parallel lines that previously guided prices higher, and the red moving average. The focus now shifts to $85.17 support.
A daily close below $85.17 would expose $77.22. Resistance stands at $93.33, followed by $104.98, with the broken channel also forming an overhead barrier. RSI has fallen below 40, showing weak momentum without reaching the conventional oversold threshold of 30. My bias remains bearish, favoring failed rebounds below $93.33. A daily close below $85.17 would confirm further weakness; reclaiming $93.33 and the broken channel would invalidate the immediate bearish view.
Brent Crude Oil Technical Analysis: Trendline Break Leaves $87.95 Exposed
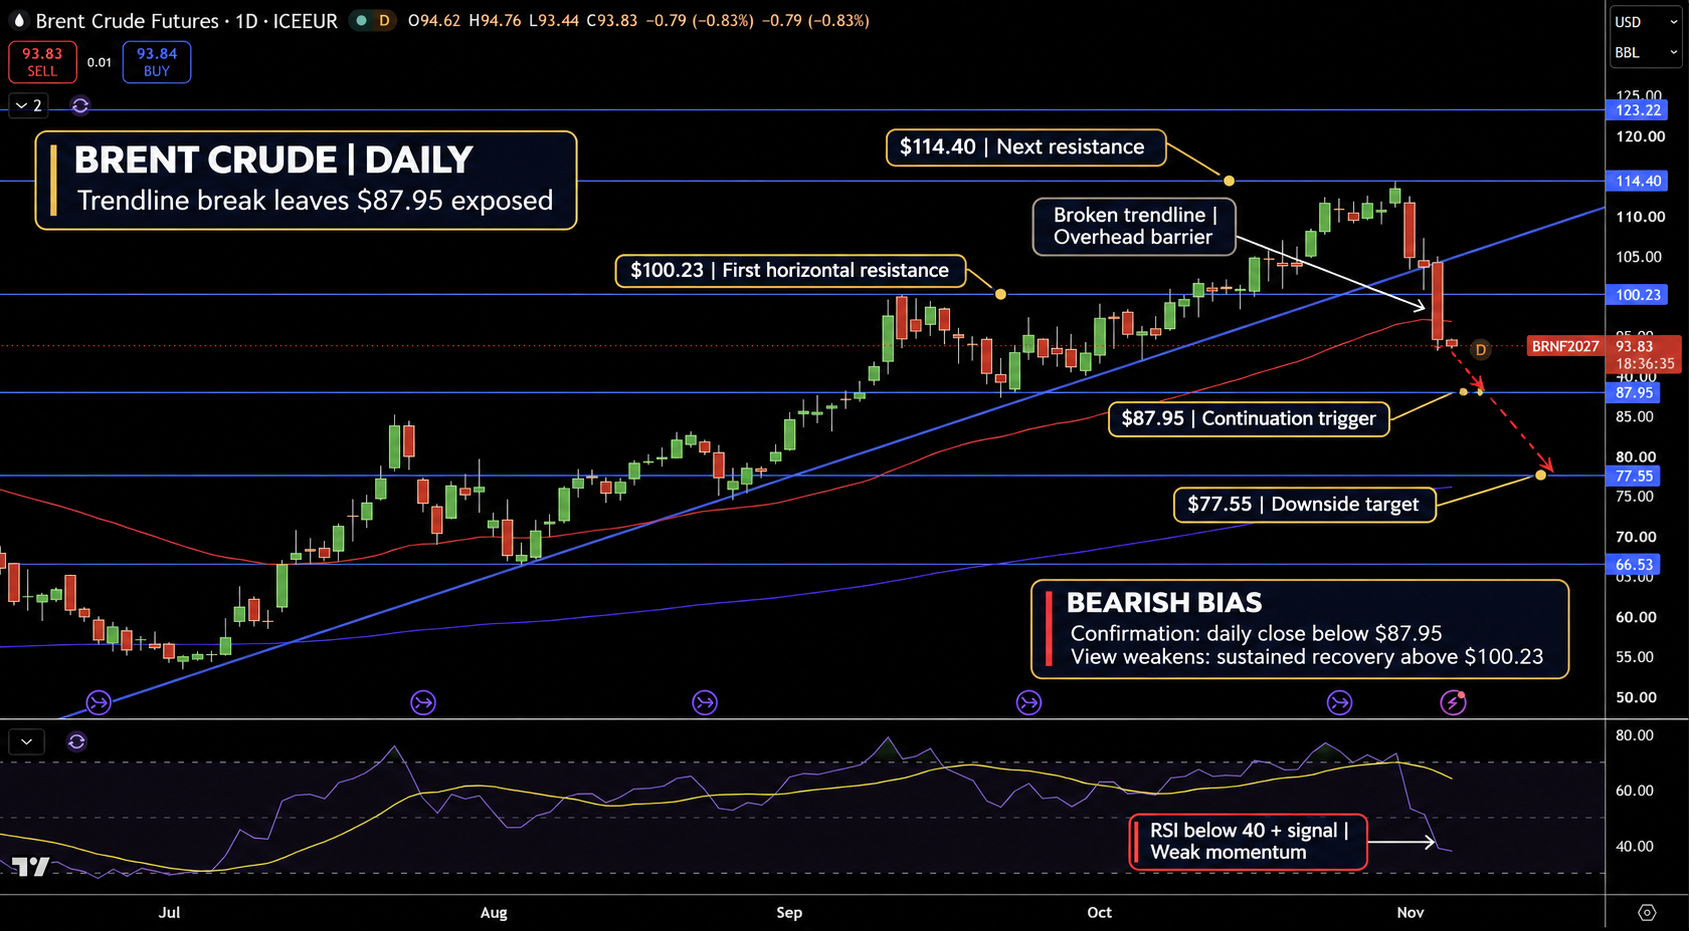
January 2027 Brent futures trade near $93.83 per barrel on the daily ICEEUR chart. Price has broken its rising trendline, a line connecting higher lows, and slipped below the red moving average. The small latest candle offers little evidence that buyers have regained control.
Support stands at $87.95, followed by $77.55. The first marked horizontal resistance is $100.23, with $114.40 farther above. The broken trendline also remains an obstacle to recovery. RSI is below 40 and its signal line, a slower average of RSI, supporting the bearish structure. I would watch for failed rebounds, with a daily close below $87.95 confirming further downside risk. A sustained recovery above $100.23 would weaken this view.