



Oil Slips as Iran Talks Extend; OPEC+ Holds Output Steady
Crude fell on Monday as Iranian and Qatari officials held a third straight day of talks aimed at ending the war, and the weekend passed without a major military clash. Brent had ended October at a six-month high, Reuters reported, so some of Monday’s drop is traders taking profit rather than a change of view.
Brent: Diplomacy Before the Midterms
President Trump signaled a preference for giving diplomacy more time before considering further strikes after Tuesday’s US midterm elections. Iran’s foreign minister called the talks “ongoing and progressing.” KCM Trade’s Tim Waterer called Monday’s drop a technical pullback after last week’s strong gains and warned Brent could approach $120 if rhetoric on Iran rises after the vote. The security risk has not gone anywhere. The US ordered non-emergency staff to leave Saudi Arabia on October 21, Reuters reported, and last week brought Houthi strikes on Saudi refineries.
OPEC+: Easy Call Now, Harder One Later
Seven core OPEC+ members, Saudi Arabia, Russia, Iraq, Kuwait, Algeria, Kazakhstan and Oman, kept December production targets unchanged on Sunday, holding the level set in September. Their combined targets stand at about 31mn bpd, but most members are pumping well below them because of the war, so the quota is a ceiling nobody is near. Saudi Arabia still lifted crude exports in October from September despite the Houthi attacks, according to two of three ship-tracking firms cited by Reuters
WTI and Natural Gas: Drilling Mix Shifts
US oil rigs rose by two to 462, their highest since early October, while gas rigs fell by two to 130, the lowest since early September, Baker Hughes said Friday. The total held at 603 for a third straight week, up 57 from a year ago. Drillers are following the price: oil above $100 attracts rigs, gas below $3 loses them.
For gas, last week’s 80 Bcf storage build ended a 10-week run of below-average injections. Persistently mild forecasts continue to limit heating demand heading into November, NGI reported.
Natural Gas Price Forecast
Every new Natural Gas analysis as it publishes, today's technical signal and key levels, live price — on one page.
See all Natural Gas forecastsWTI Technical Analysis: Oil Drops Toward $99.61 After Channel Break
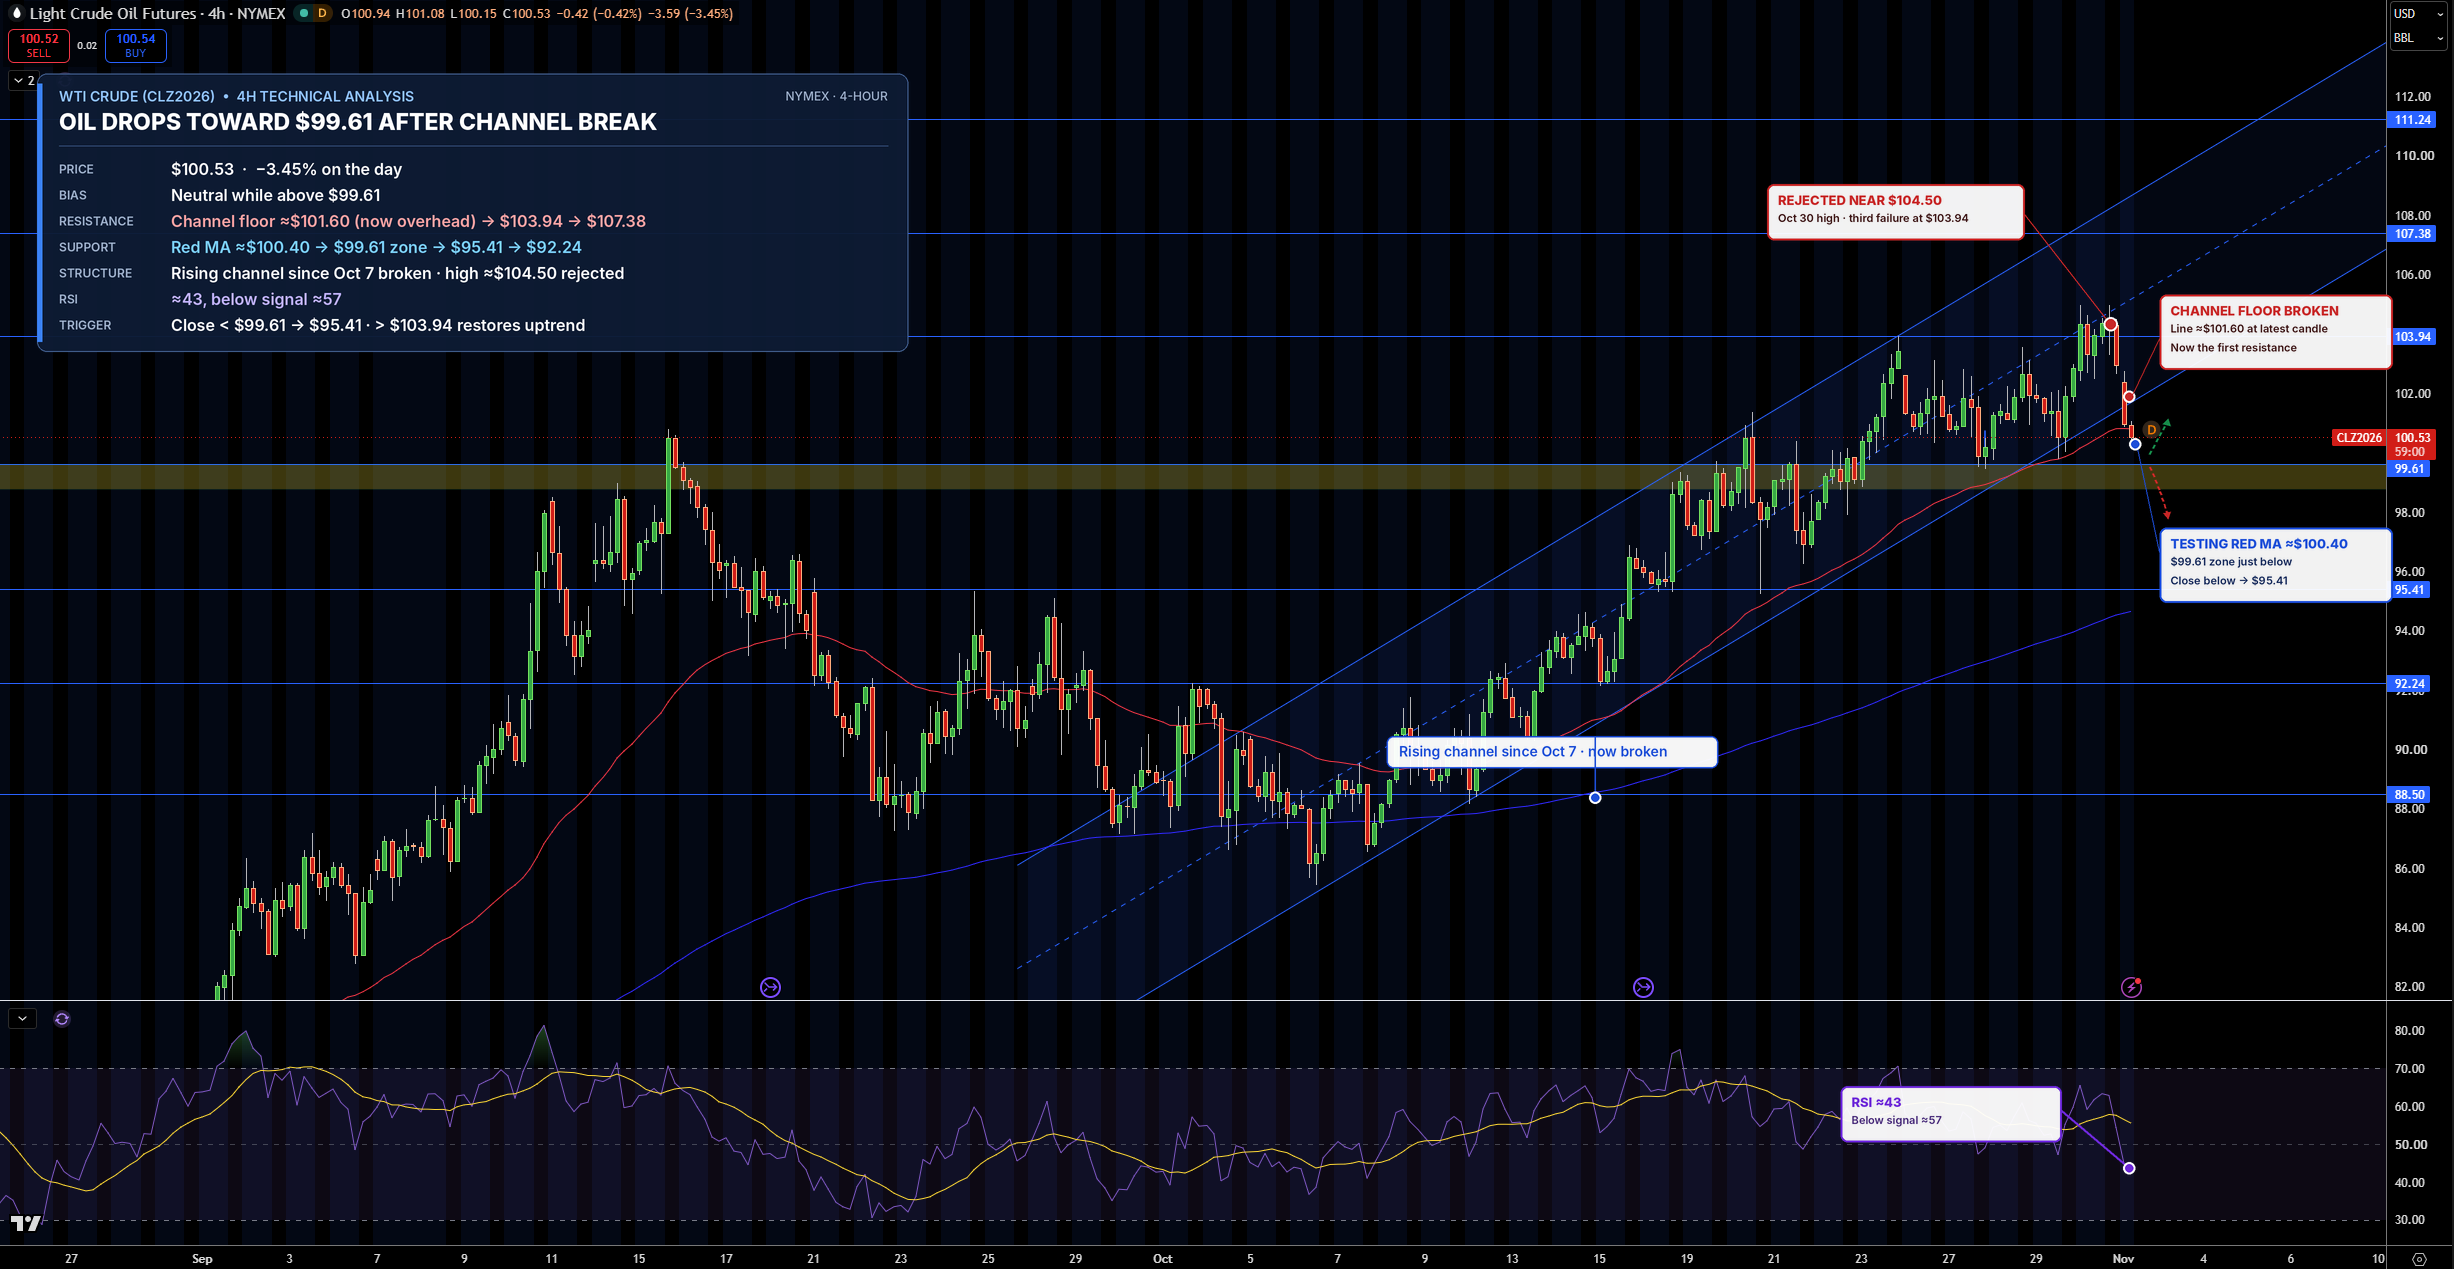
WTI is trading near $100.53 on the 4-hour chart. Oil was rejected near $104.50 and has slipped below the bottom of its rising channel, two parallel lines that had guided prices higher since early October. It is now testing the faster moving average, a line showing the recent average price.
Support, where buyers tend to step in, is the $99.61 zone, then $95.41. Resistance, where sellers tend to step in, is the channel floor near $101.60, then $103.94, then $107.38.
RSI, which measures the strength of recent buying and selling, has dropped to about 43 and is below its signal line, a slower average of RSI. My bias is neutral while WTI holds $99.61. A close below it would open $95.41, while a move above $103.94 would restore the uptrend.
Brent Technical Analysis: Oil Falls to $109.17 Support as Channel Floor Is Tested
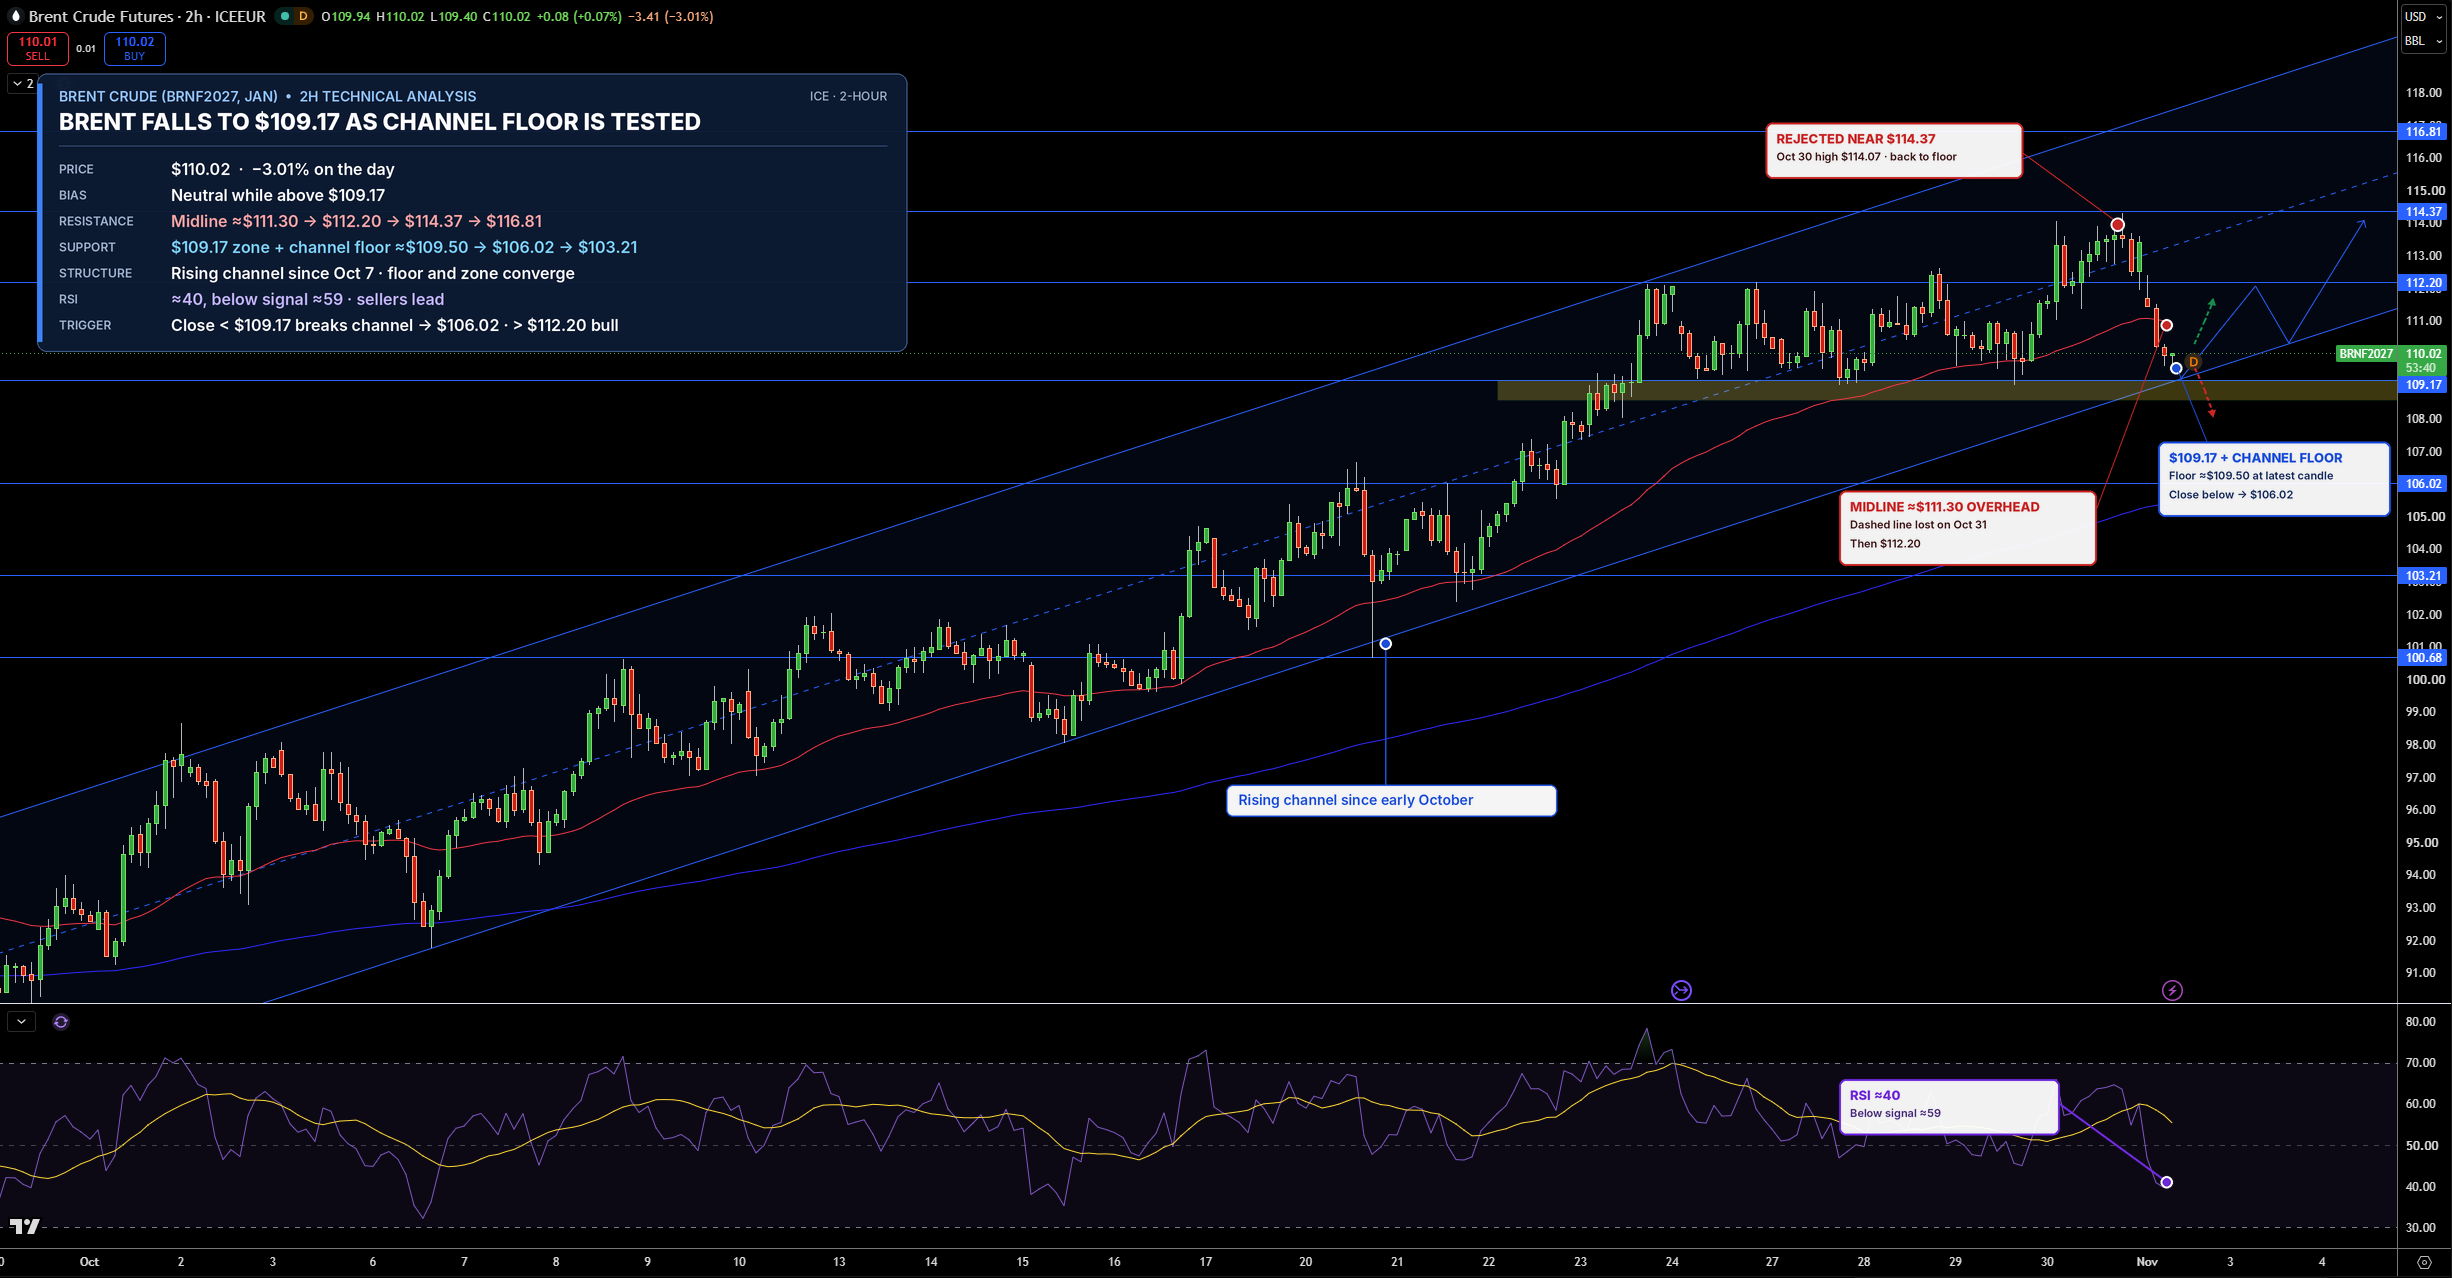
January Brent futures are trading near $110.02 on the 2-hour chart. Brent was rejected near $114.37 and dropped back to the $109.17 zone. That floor has held since late October, and it now lines up with the bottom of the rising channel.
The first support is $109.17, then $106.02. On the upside, the first resistance is the midline near $111.30, then $112.20, followed by $114.37.
RSI has fallen to about 40 and is below its signal line, so sellers have the upper hand for now. I stay neutral while Brent holds $109.17. A close below it would break the channel and open $106.02, while a move above $112.20 would favor buyers.
Natural Gas Technical Analysis: NG Tests Falling Trendline as $2.80 Floor Holds
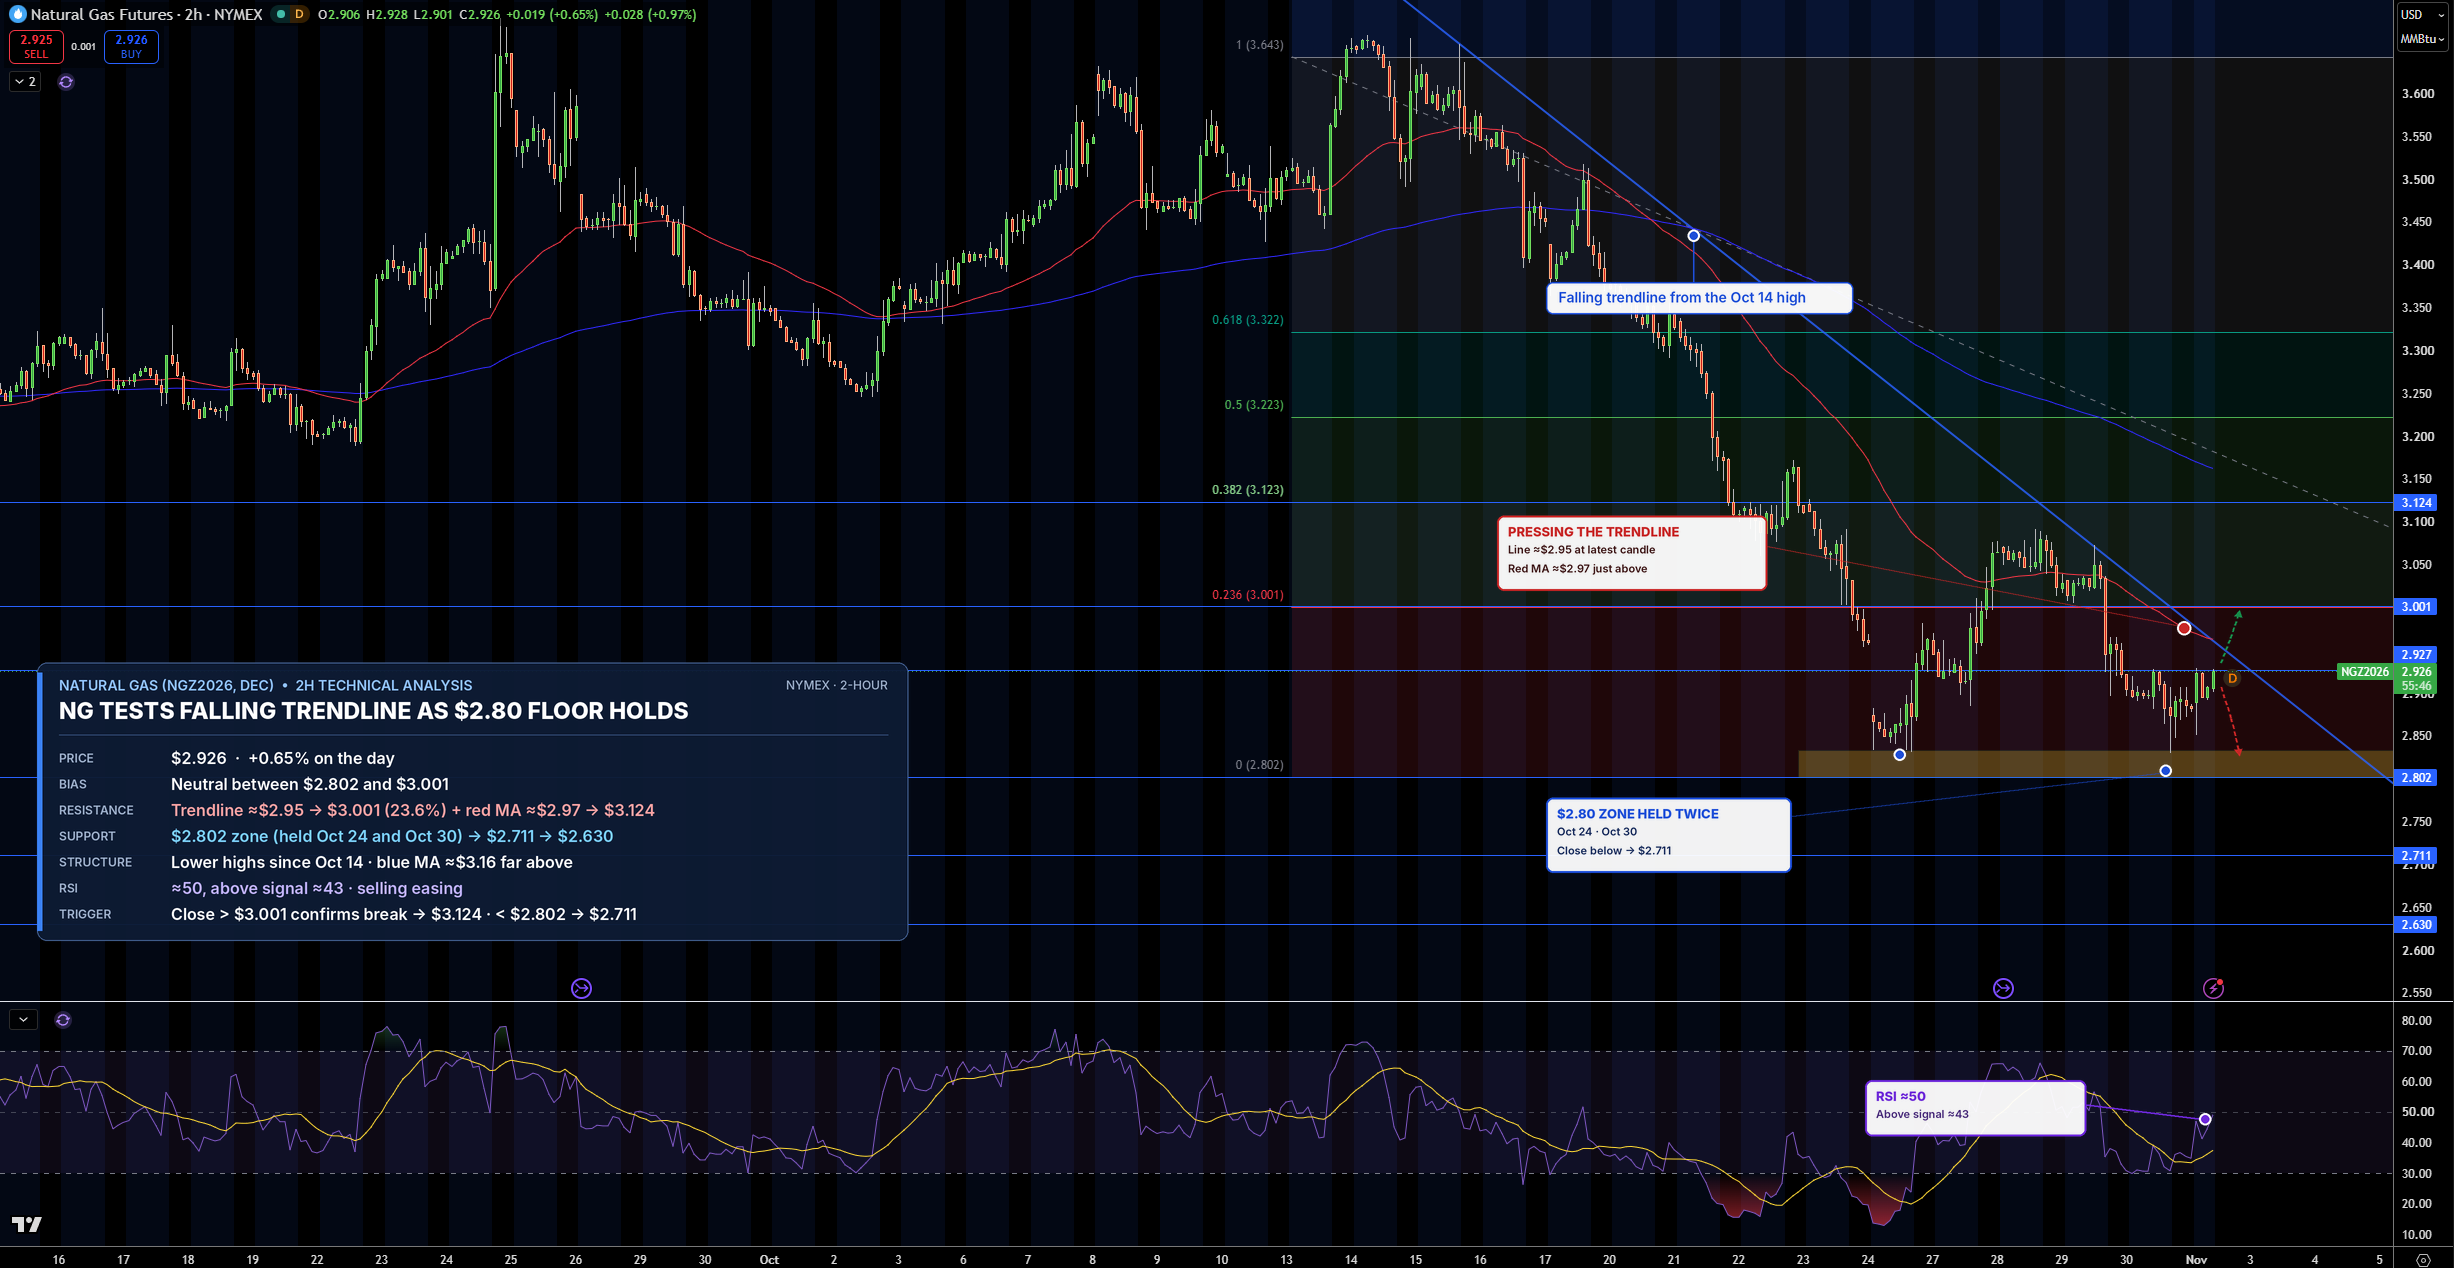
December natural gas is trading near $2.93/MMBtu on the 2-hour chart. Buyers defended the $2.80 zone for a second time last week, and prices are now pressing against a falling trendline, a line connecting lower highs since mid-October.
The first resistance is $3.00, then $3.12. Support sits at $2.80, then $2.71.
RSI has climbed to about 50 and is above its signal line, so selling pressure is easing. In my view, gas stays neutral between $2.80 and $3.00. A close above $3.00 would confirm a trendline break, while a drop below $2.80 would open $2.71.