



Oil Heads for Fourth Monthly Gain as Houthis Widen Saudi Attacks
Crude rose on Friday and is on course for a fourth straight monthly gain, the steepest since July, after Yemen’s Houthis widened their attacks on Saudi Arabia’s energy system, Reuters reported. Brent is up nearly 14% in October and WTI about 15%, set for its first monthly close above $100 since April. Natural gas moved the other way after a bigger-than-expected storage build.
Brent: Strikes Spread Across Saudi Infrastructure
The Houthis claimed attacks on Thursday on Saudi Arabia’s Ras Tanura and Rabigh refineries and an Aramco facility at Abqaiq. The spread matters: Abqaiq is the plant that processes most of Saudi crude before export. ExxonMobil and Chevron have cancelled executive travel to the UAE’s biggest oil show next week over security concerns, sources told Reuters.
Diplomacy is not filling the gap. A senior Iranian official dismissed a Qatari draft deal as unacceptable, and President Trump played down Vice President JD Vance’s letter to Tehran, saying it concerned medical supplies. MST Marquee’s Saul Kavonic said doubts over a viable diplomatic path are keeping prices elevated in expectation of escalation in the coming weeks.
WTI: Russia Offers Partial Relief
JPMorgan said Russian refinery runs rebounded by 350,000 barrels a day last week to 4mn bpd, which could add to global diesel supply after months of strikes on Russian plants. That is the only loosening in the picture. US crude stocks fell 1.9mn barrels in the week to October 23, the EIA said, a fourth straight weekly decline.
Natural Gas: Storage Streak Snaps
The EIA reported an 80 Bcf injection for the week to October 23, above expectations, and it ended a 10-week run of below-average builds, NGI said. Inventories reached 3,724 Bcf, 38 Bcf above the five-year average but 147 Bcf below last year, so the cushion is normal rather than ample. The South Central region, home to the Gulf Coast salt caverns that supply LNG plants, accounted for more than half the build. On the demand side, NextDecade expects to introduce gas into its Rio Grande LNG terminal before year-end, which would add a new buyer just as winter starts.
Natural Gas Price Forecast
Every new Natural Gas analysis as it publishes, today's technical signal and key levels, live price — on one page.
See all Natural Gas forecastsWTI Technical Analysis: Oil Tests $103.94 Again as Buyers Push Higher
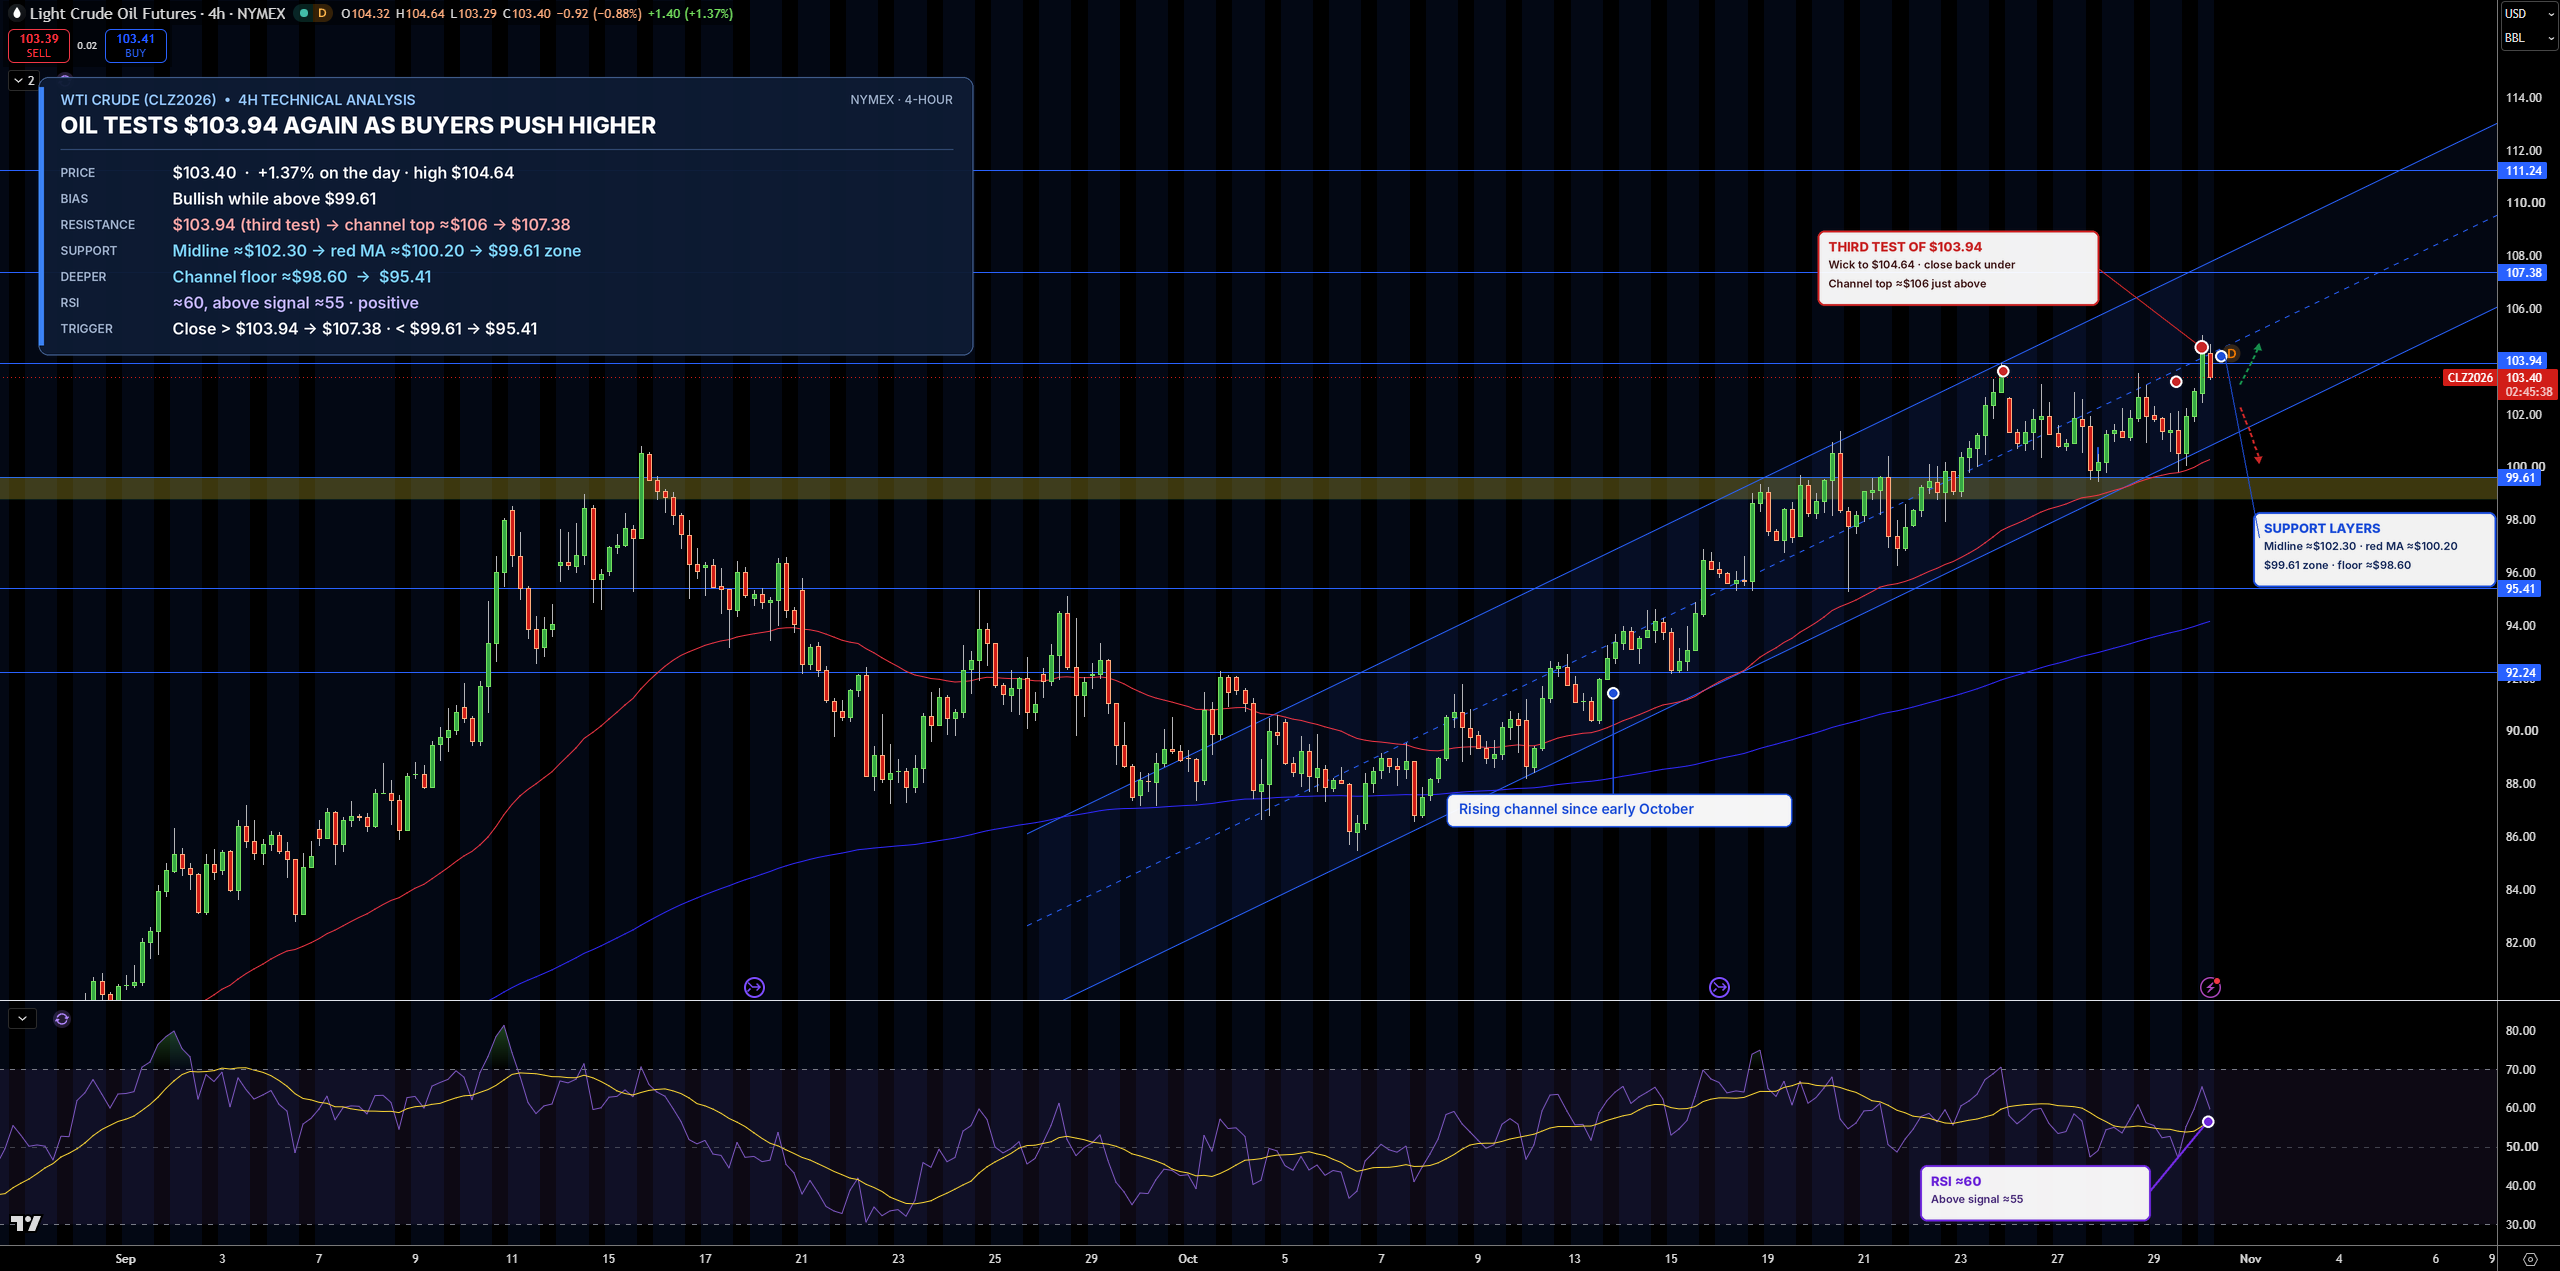
WTI is trading near $103.40 on the 4-hour chart, up about 1.4% today. Oil briefly rose above $103.94 to $104.64, then slipped back below it, the third test of that ceiling in a week. Prices are still rising inside a channel, two parallel lines that have guided them higher since early October.
Resistance, where sellers tend to step in, is $103.94, then $107.38. Support, where buyers tend to step in, is $99.61, then $95.41.
RSI, which measures the strength of recent buying and selling, is near 60 and above its signal line, a slower average of RSI, so momentum is positive. I stay bullish while WTI holds $99.61. Only a close above $103.94 would confirm a breakout and open $107.38; a brief spike through it does not count.
Brent Technical Analysis: Oil Spikes to $114 but Falls Back to $112.20
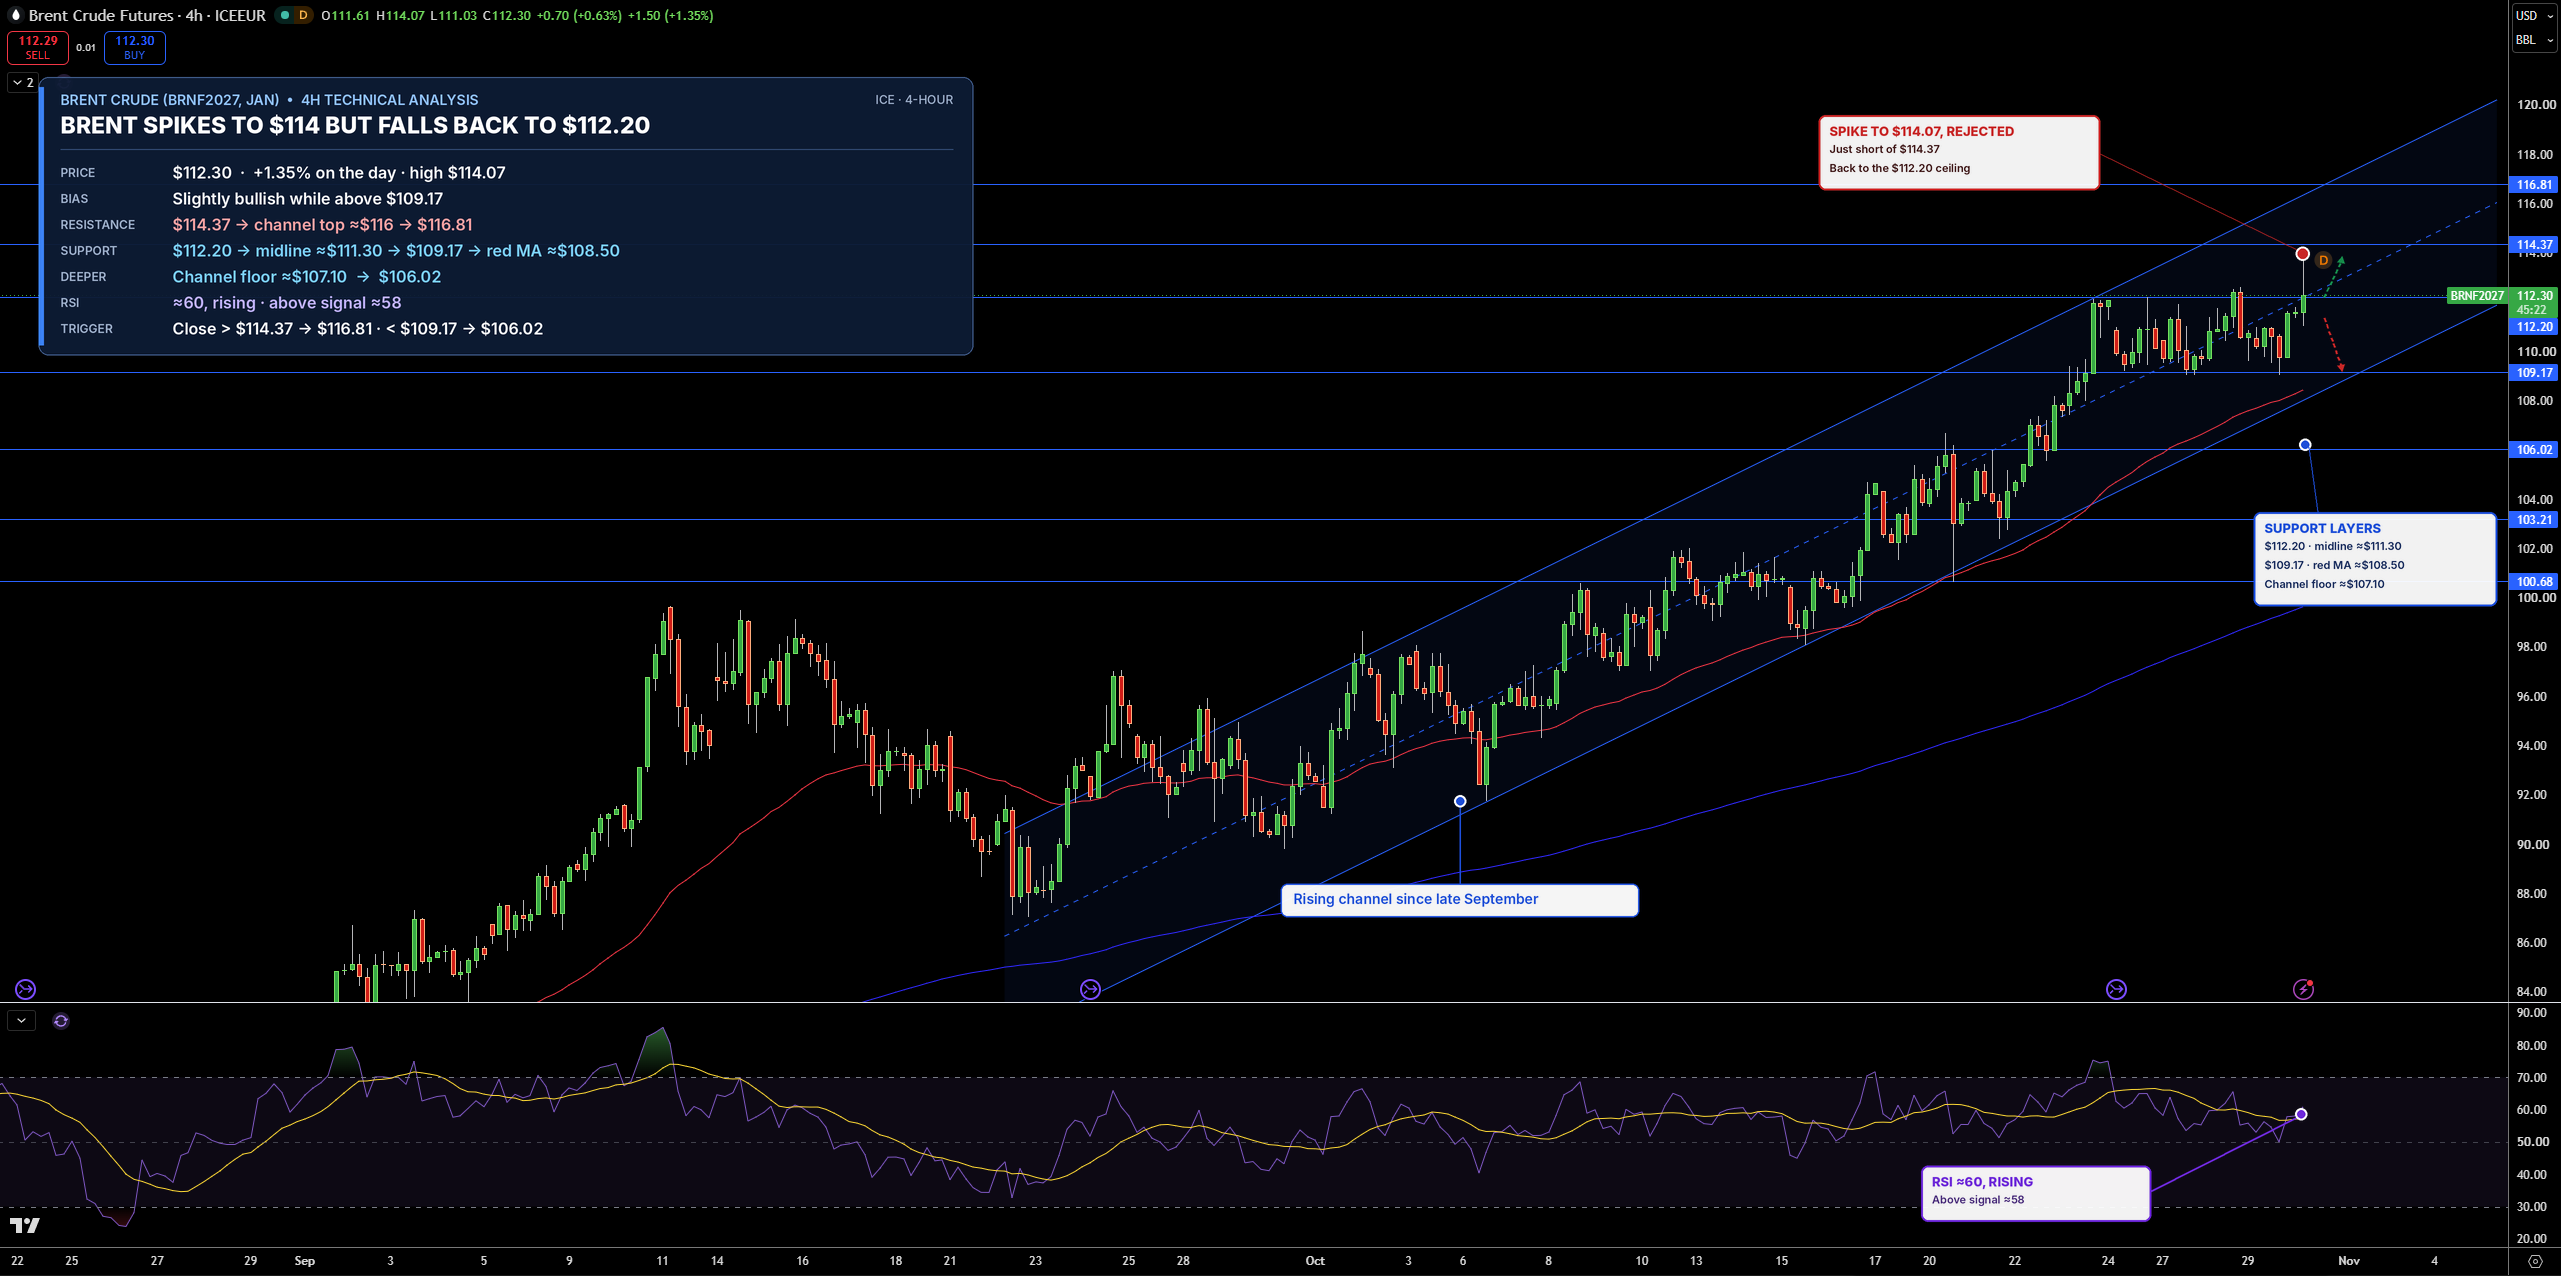
January Brent futures are trading near $112.30 on the 4-hour chart, up about 1.4% today. Brent jumped to $114.07, above the $112.20 ceiling that has capped it for a week, but quickly gave back most of the gain. It is still rising inside its channel.
The first resistance is $114.37, then $116.81. On the downside, $112.20 is the first support, followed by $109.17.
RSI is near 60 and rising, which is positive but not stretched. Brent keeps a slight bullish lean while it holds $109.17. A close above $114.37 would open $116.81.
Natural Gas Technical Analysis: NG Drops Below $3.00 as $2.80 Comes Into Focus
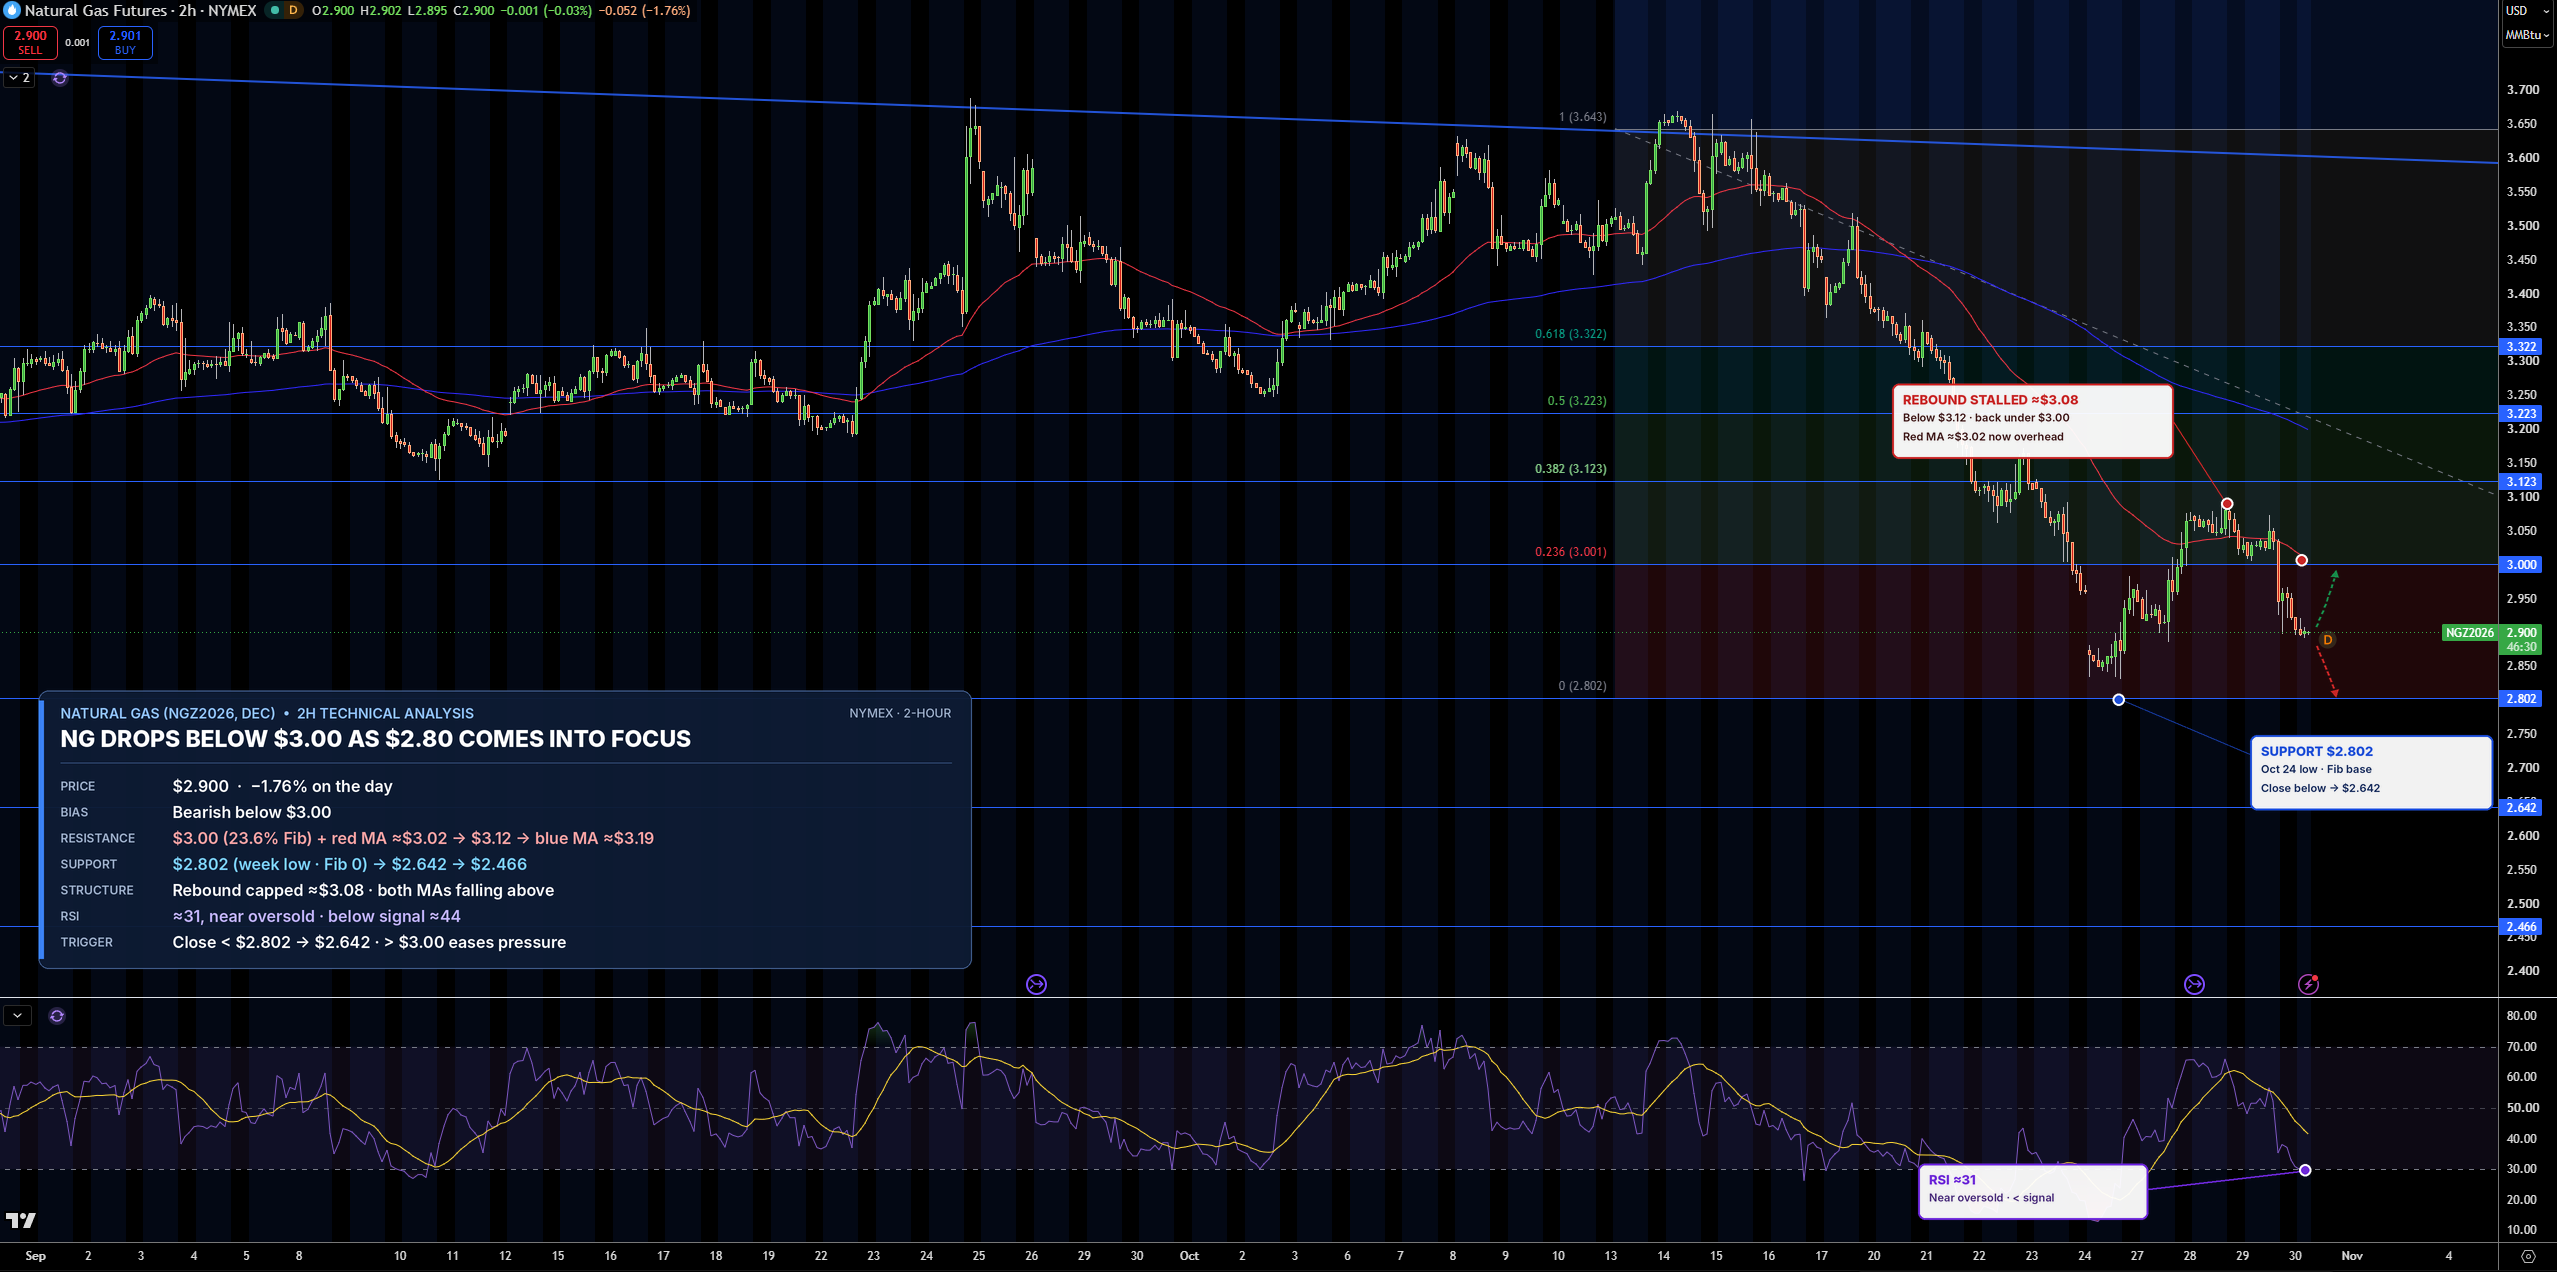
December natural gas is trading near $2.90/MMBtu on the 2-hour chart, down about 1.8% today. The rebound stalled near $3.08, and prices have dropped back below $3.00. Both moving averages, lines showing the average price over time, are falling above price.
The first support is $2.80, this week’s low, then $2.64. Resistance sits at $3.00, then $3.12.
RSI is near 31, close to oversold, meaning prices fell very fast. In my view, gas stays bearish below $3.00. A close below $2.80 would open $2.64.