



Oil fundamentals are tightening on two fronts this Thursday. Attacks in Saudi Arabia are intensifying, and US inventories posted a third straight weekly decline. Natural gas faces the opposite problem: too little heating demand.
Brent: Saudi Risk Escalates, Gulf Exports Adapt
A drone targeting Saudi Arabia’s Shaybah oilfield was intercepted, but falling debris killed two people, the Saudi energy ministry said. A separate attack on Dammam’s King Fahd International Airport killed one person and injured eight. The State Department then ordered non-emergency US government staff and their families to leave Saudi Arabia, citing escalating Houthi attacks on airports and critical infrastructure.
Supply is adapting, though. Middle East oil exports, excluding Iran, have risen above 24mn barrels a day, up from 23.3mn before the war, according to Kpler, as Saudi Arabia and the UAE route more crude through pipelines that bypass the Strait of Hormuz.
WTI: A Third Weekly Draw
The EIA said commercial crude stocks fell 3.06mn barrels to 412.5mn in the week to October 16, against an 820,000-barrel draw forecast in a Reuters poll. Gasoline stocks dropped 2.95mn barrels. Distillates rose 1.68mn barrels but remain 9% below the five-year average. Crude stocks at the Cushing hub increased by 987,000 barrels.
Natural Gas: Warm Outlook Overrides a Thinner Cushion
US gas futures slid to a four-week low on Wednesday as forecasts for mild weather through early November curbed heating demand. LSEG expects demand of 108 bcfd next week, below the five-year average of 117 bcfd, while output has averaged 111.5 bcfd so far in October. NGI expects today’s EIA report to show an 82 Bcf injection, and says East region stocks could slip into a deficit against last year after a pipeline leak curtailed Appalachian output in mid-October.
Natural Gas Price Forecast
Every new Natural Gas analysis as it publishes, today's technical signal and key levels, live price — on one page.
See all Natural Gas forecastsWTI Technical Analysis: USOIL Holds $97.47 as $99.59 Comes Into Focus
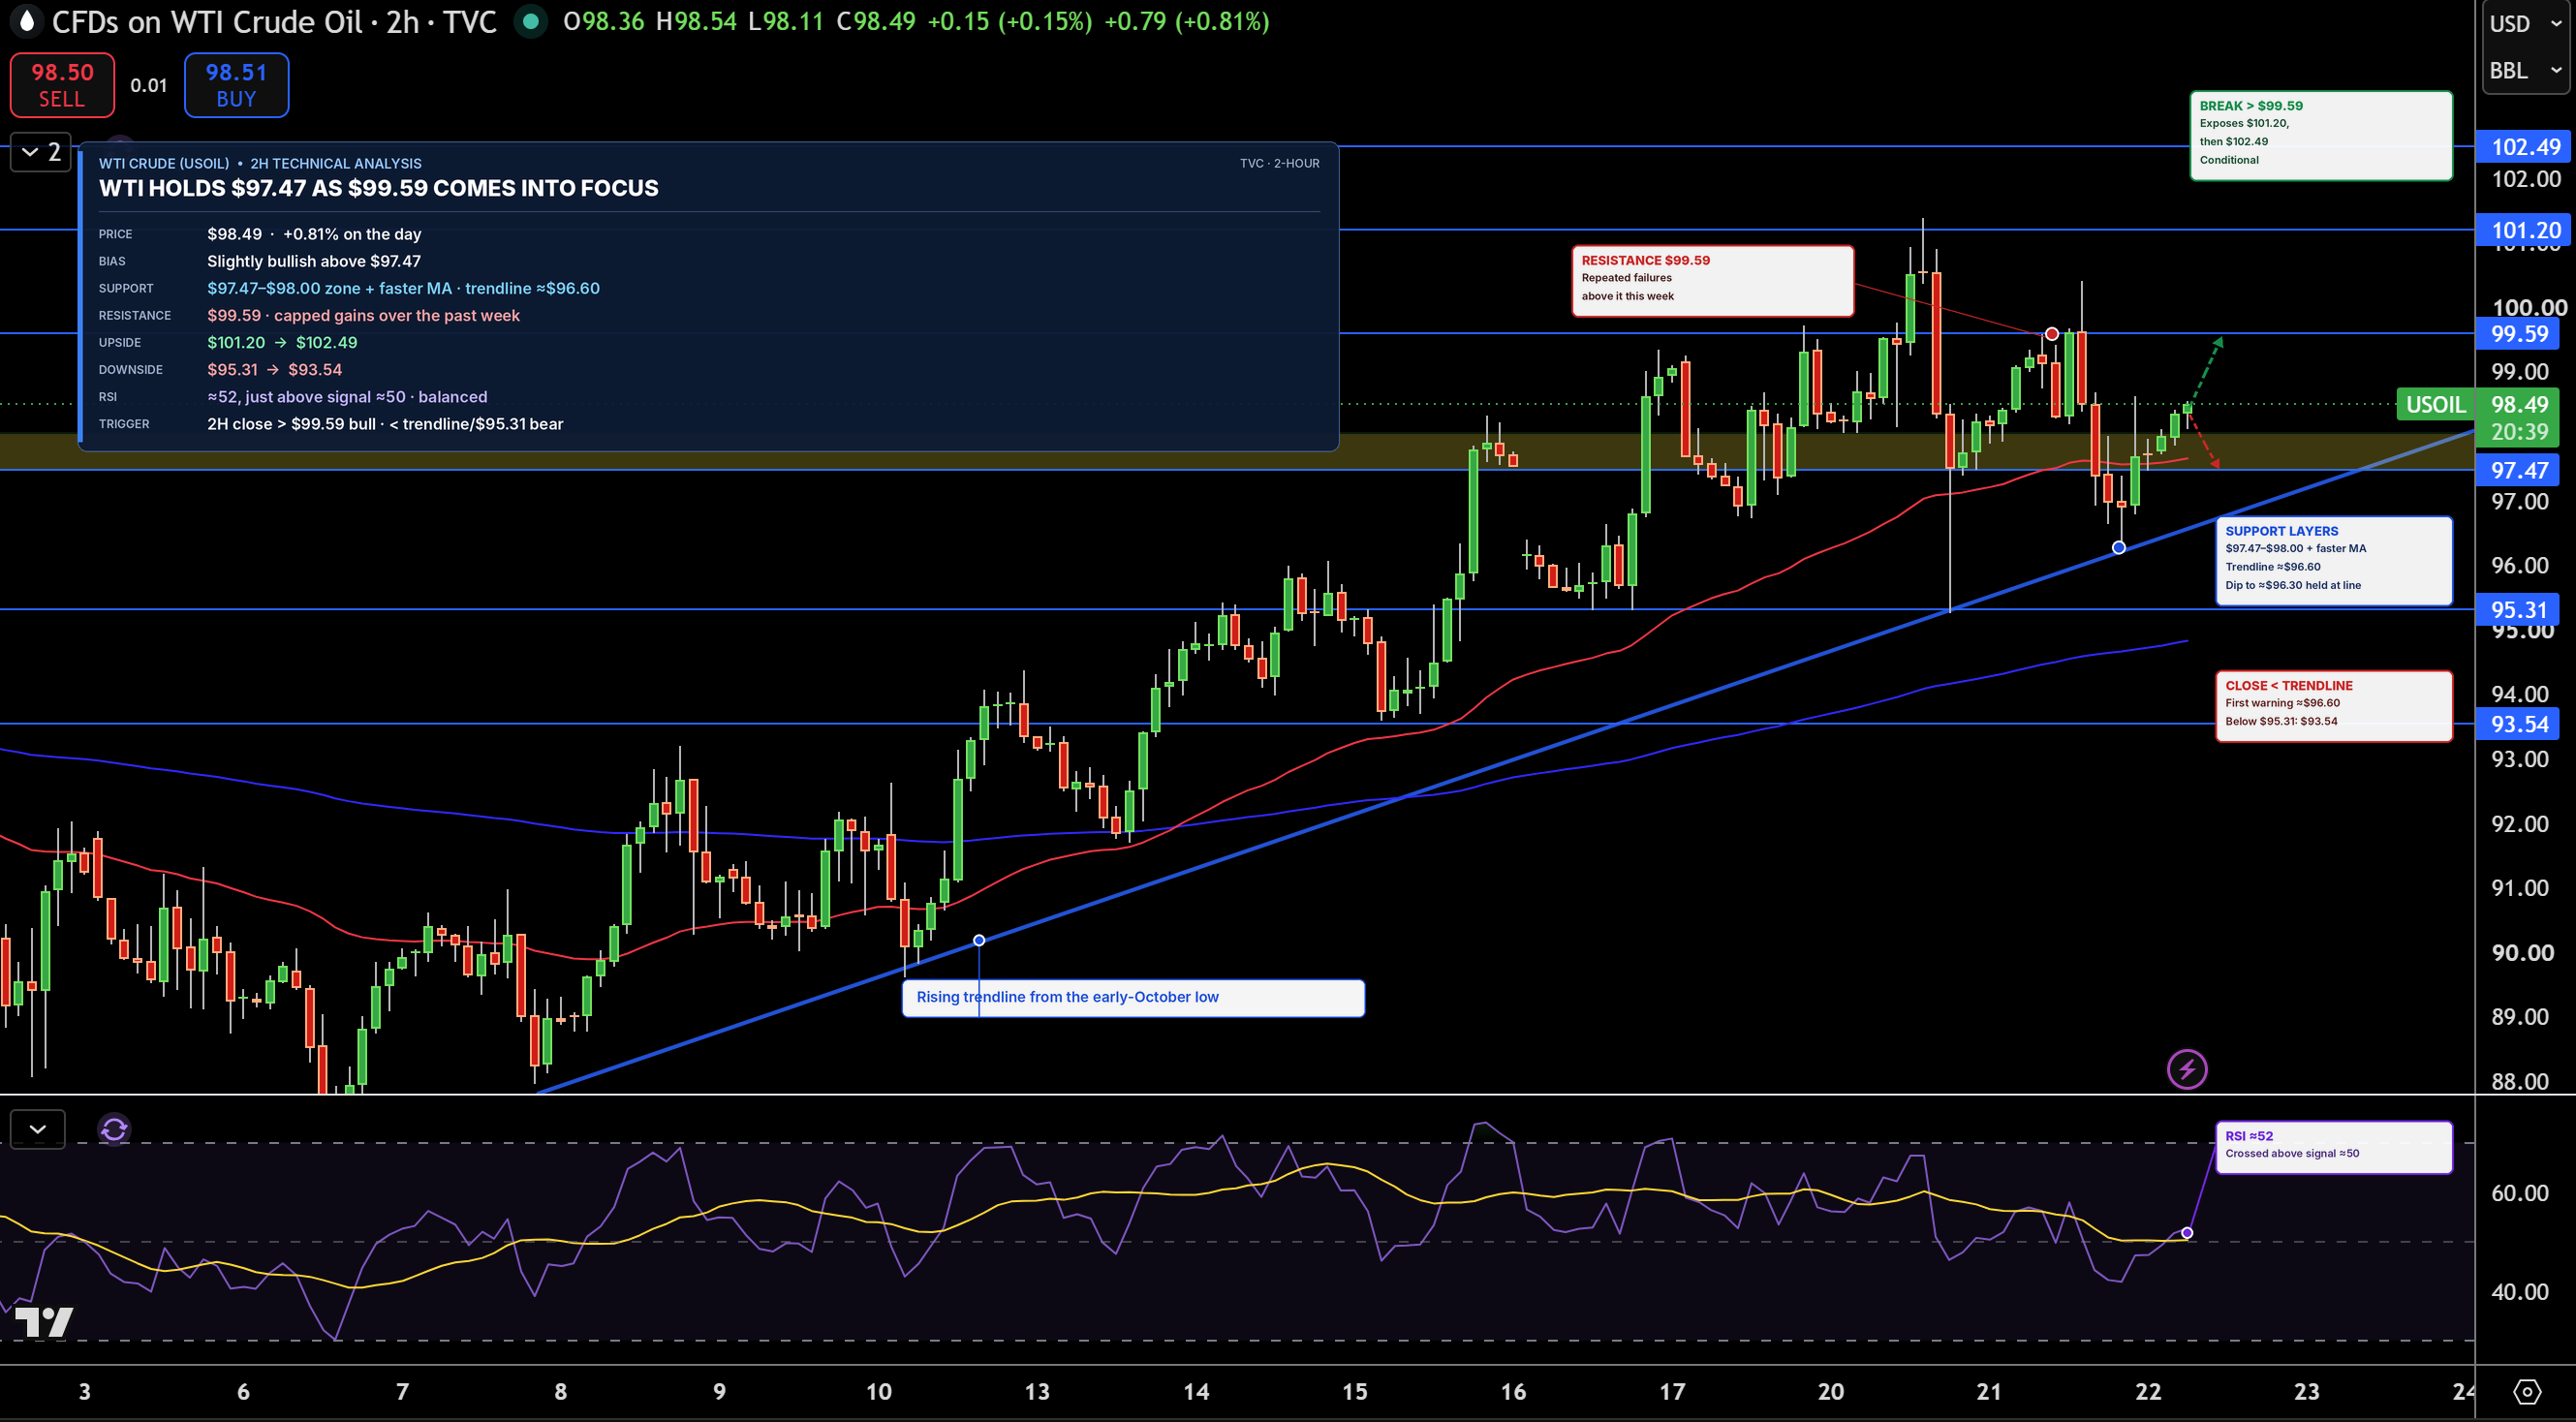
WTI crude is trading near $98.49 on the 2-hour chart. What stands out to me is how buyers stepped in again at the $97.47 to $98.00 support zone after a brief dip toward $96.30. The rising trendline from the early-October low remains intact. Price is back above the faster moving average, and both averages continue to slope higher, so the broader uptrend is still in place. However, oil has struggled to hold gains above $99.59 over the past week.
The first resistance I am watching is $99.59. A clean break above it would expose $101.20, followed by $102.49. On the downside, $97.47 and the faster moving average form the first support, with the rising trendline just below. A break there would open the way toward $95.31 and $93.54.
RSI is around 52 and has just crossed above its signal line near 50. That tells me momentum is recovering but remains balanced. I am leaning slightly bullish while WTI holds above $97.47. A sustained move above $99.59 would strengthen the uptrend, while a close below $95.31 would break the trendline structure.
Brent Technical Analysis: UKOIL Holds $108.03 as $111.98 Comes Into Focus
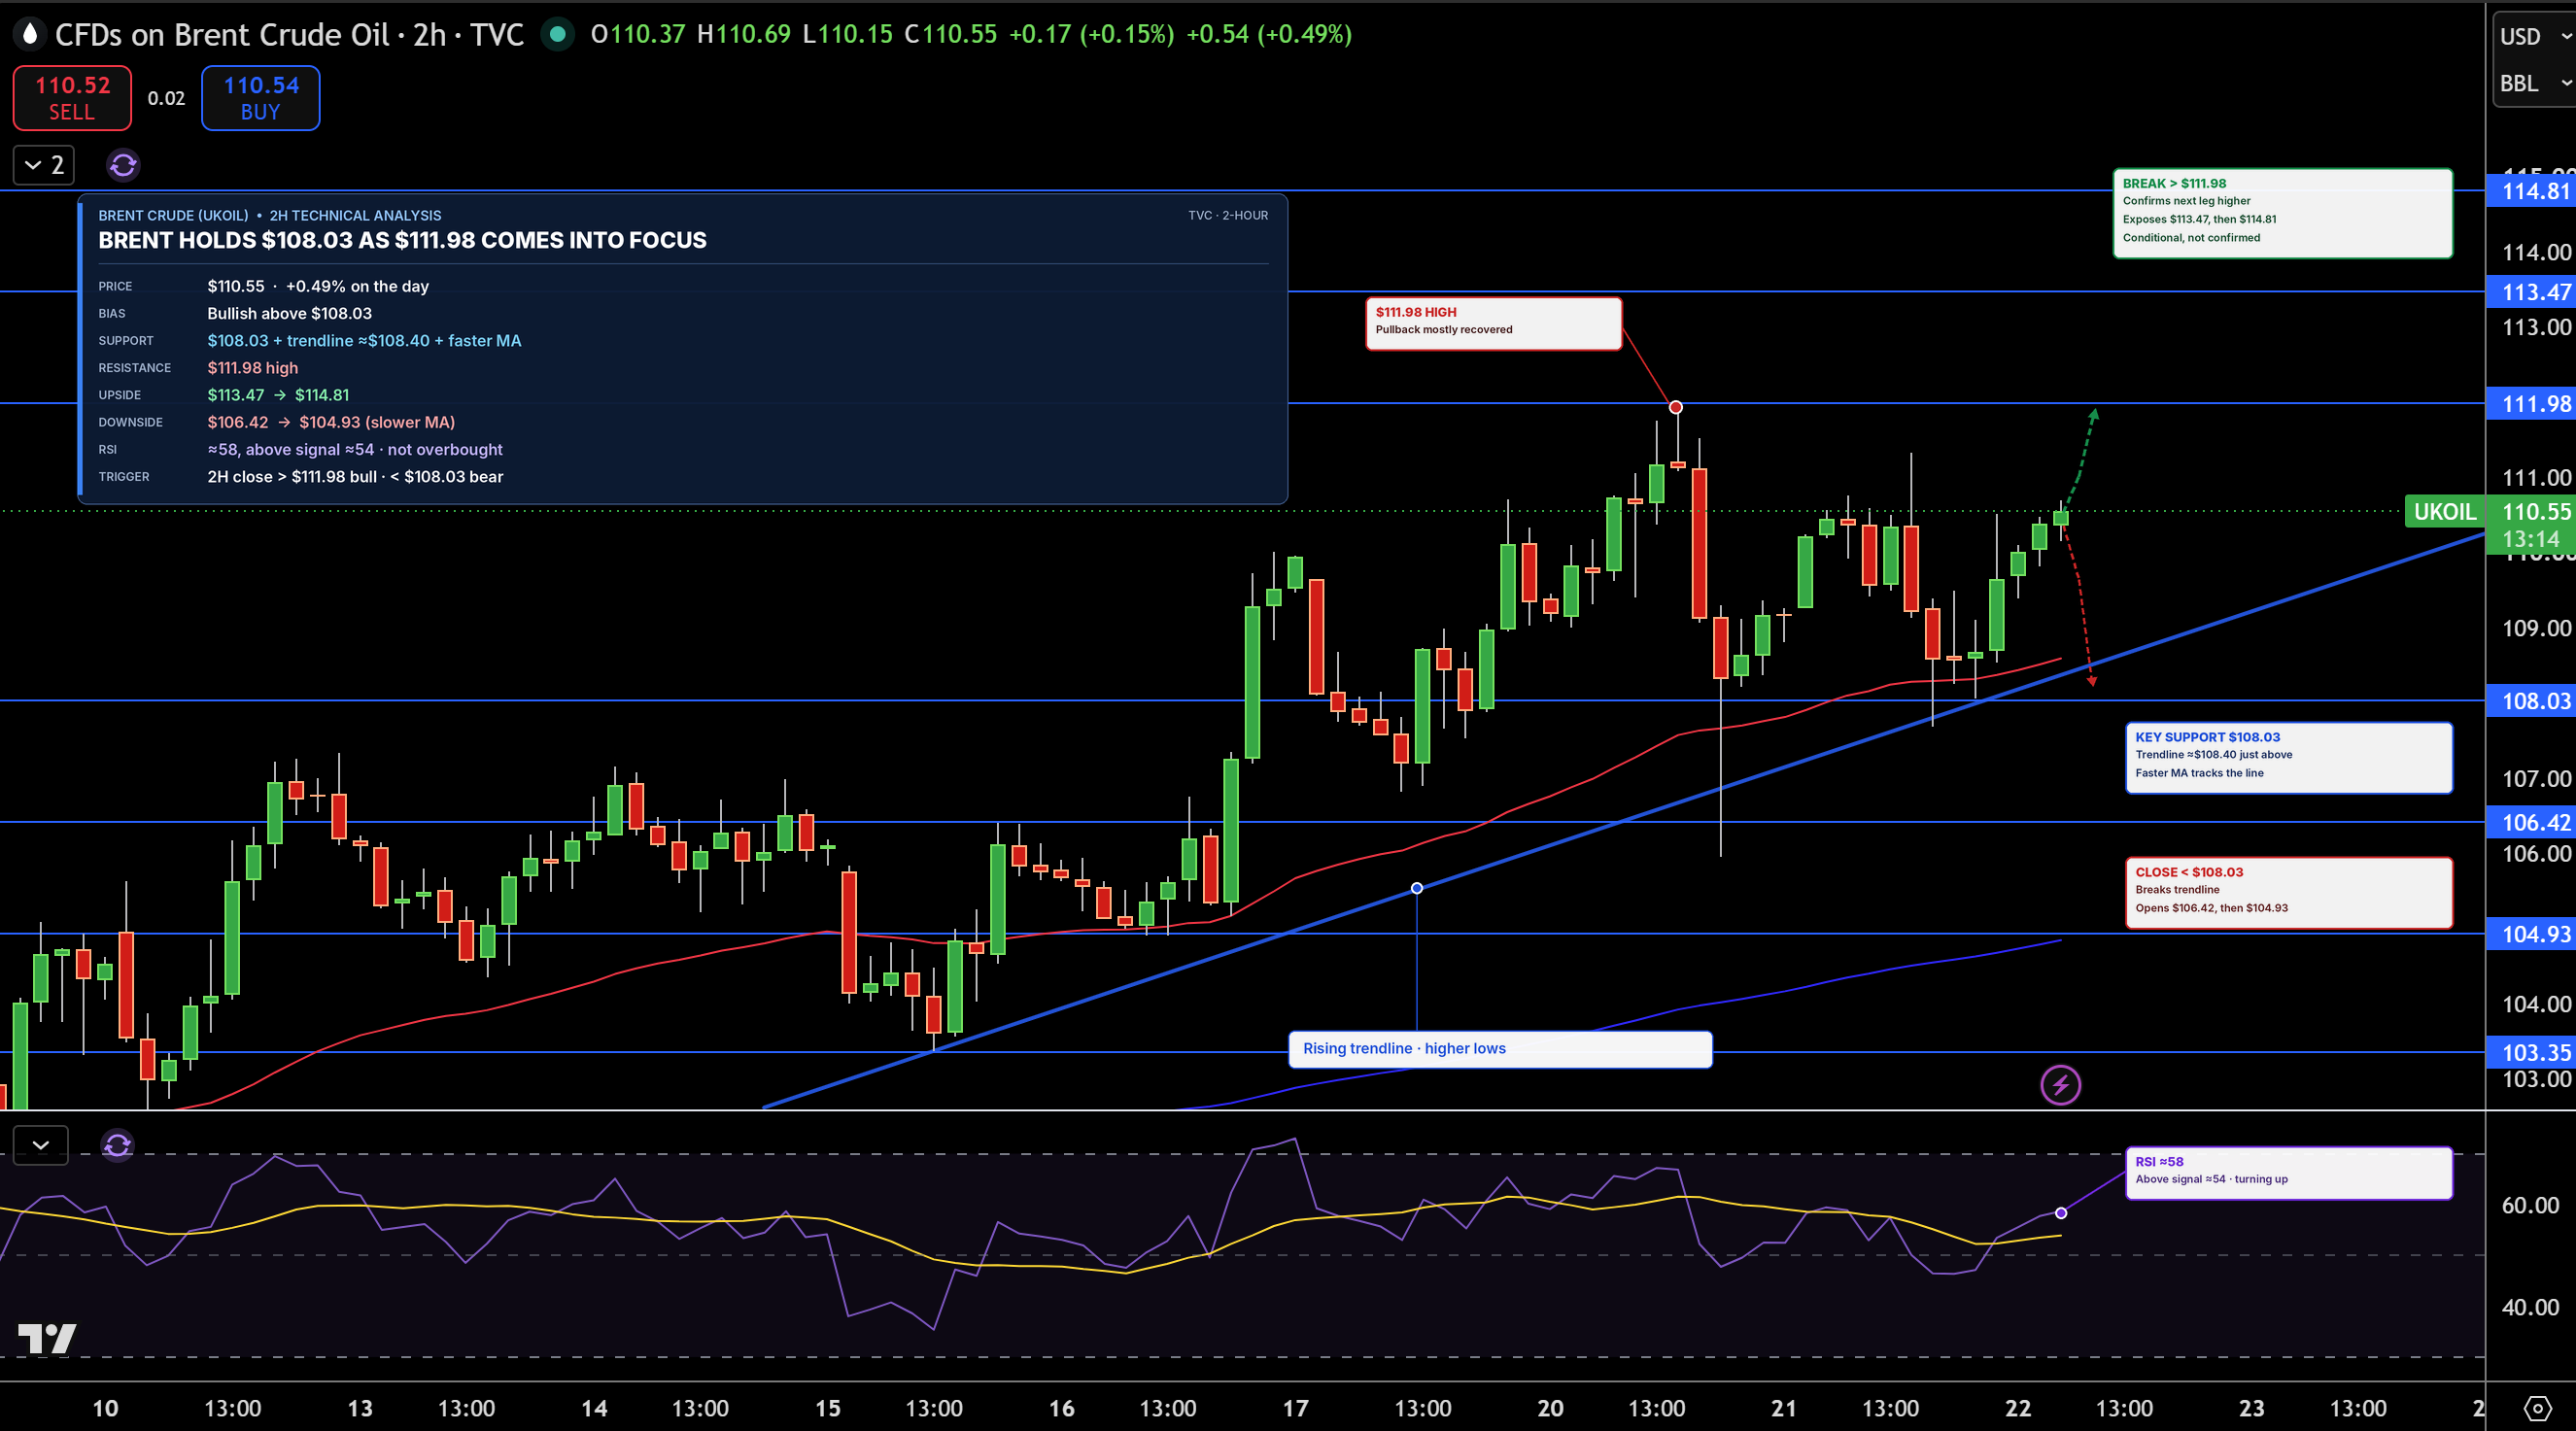
Brent is trading near $110.55 on the 2-hour chart. What stands out to me is the steady run of higher lows along the rising trendline, which buyers defended again this week near $108.03. The faster moving average is tracking that trendline closely and adding another layer of support. Price has now recovered most of the pullback from the $111.98 high.
The first resistance I am watching is $111.98. A clean break above it would expose $113.47 and then $114.81. On the downside, $108.03 and the trendline form the key support, followed by $106.42 and $104.93, where the slower moving average sits.
RSI is near 58 and above its signal line around 54, which tells me momentum is turning positive again without being overbought. I am leaning bullish as long as Brent holds above $108.03. A sustained break above $111.98 would confirm the next leg higher, while a close below $108.03 would break the trendline and point toward $106.42.
Natural Gas Technical Analysis: NG Breaks Below Channel as $2.68 Support Comes Into Focus
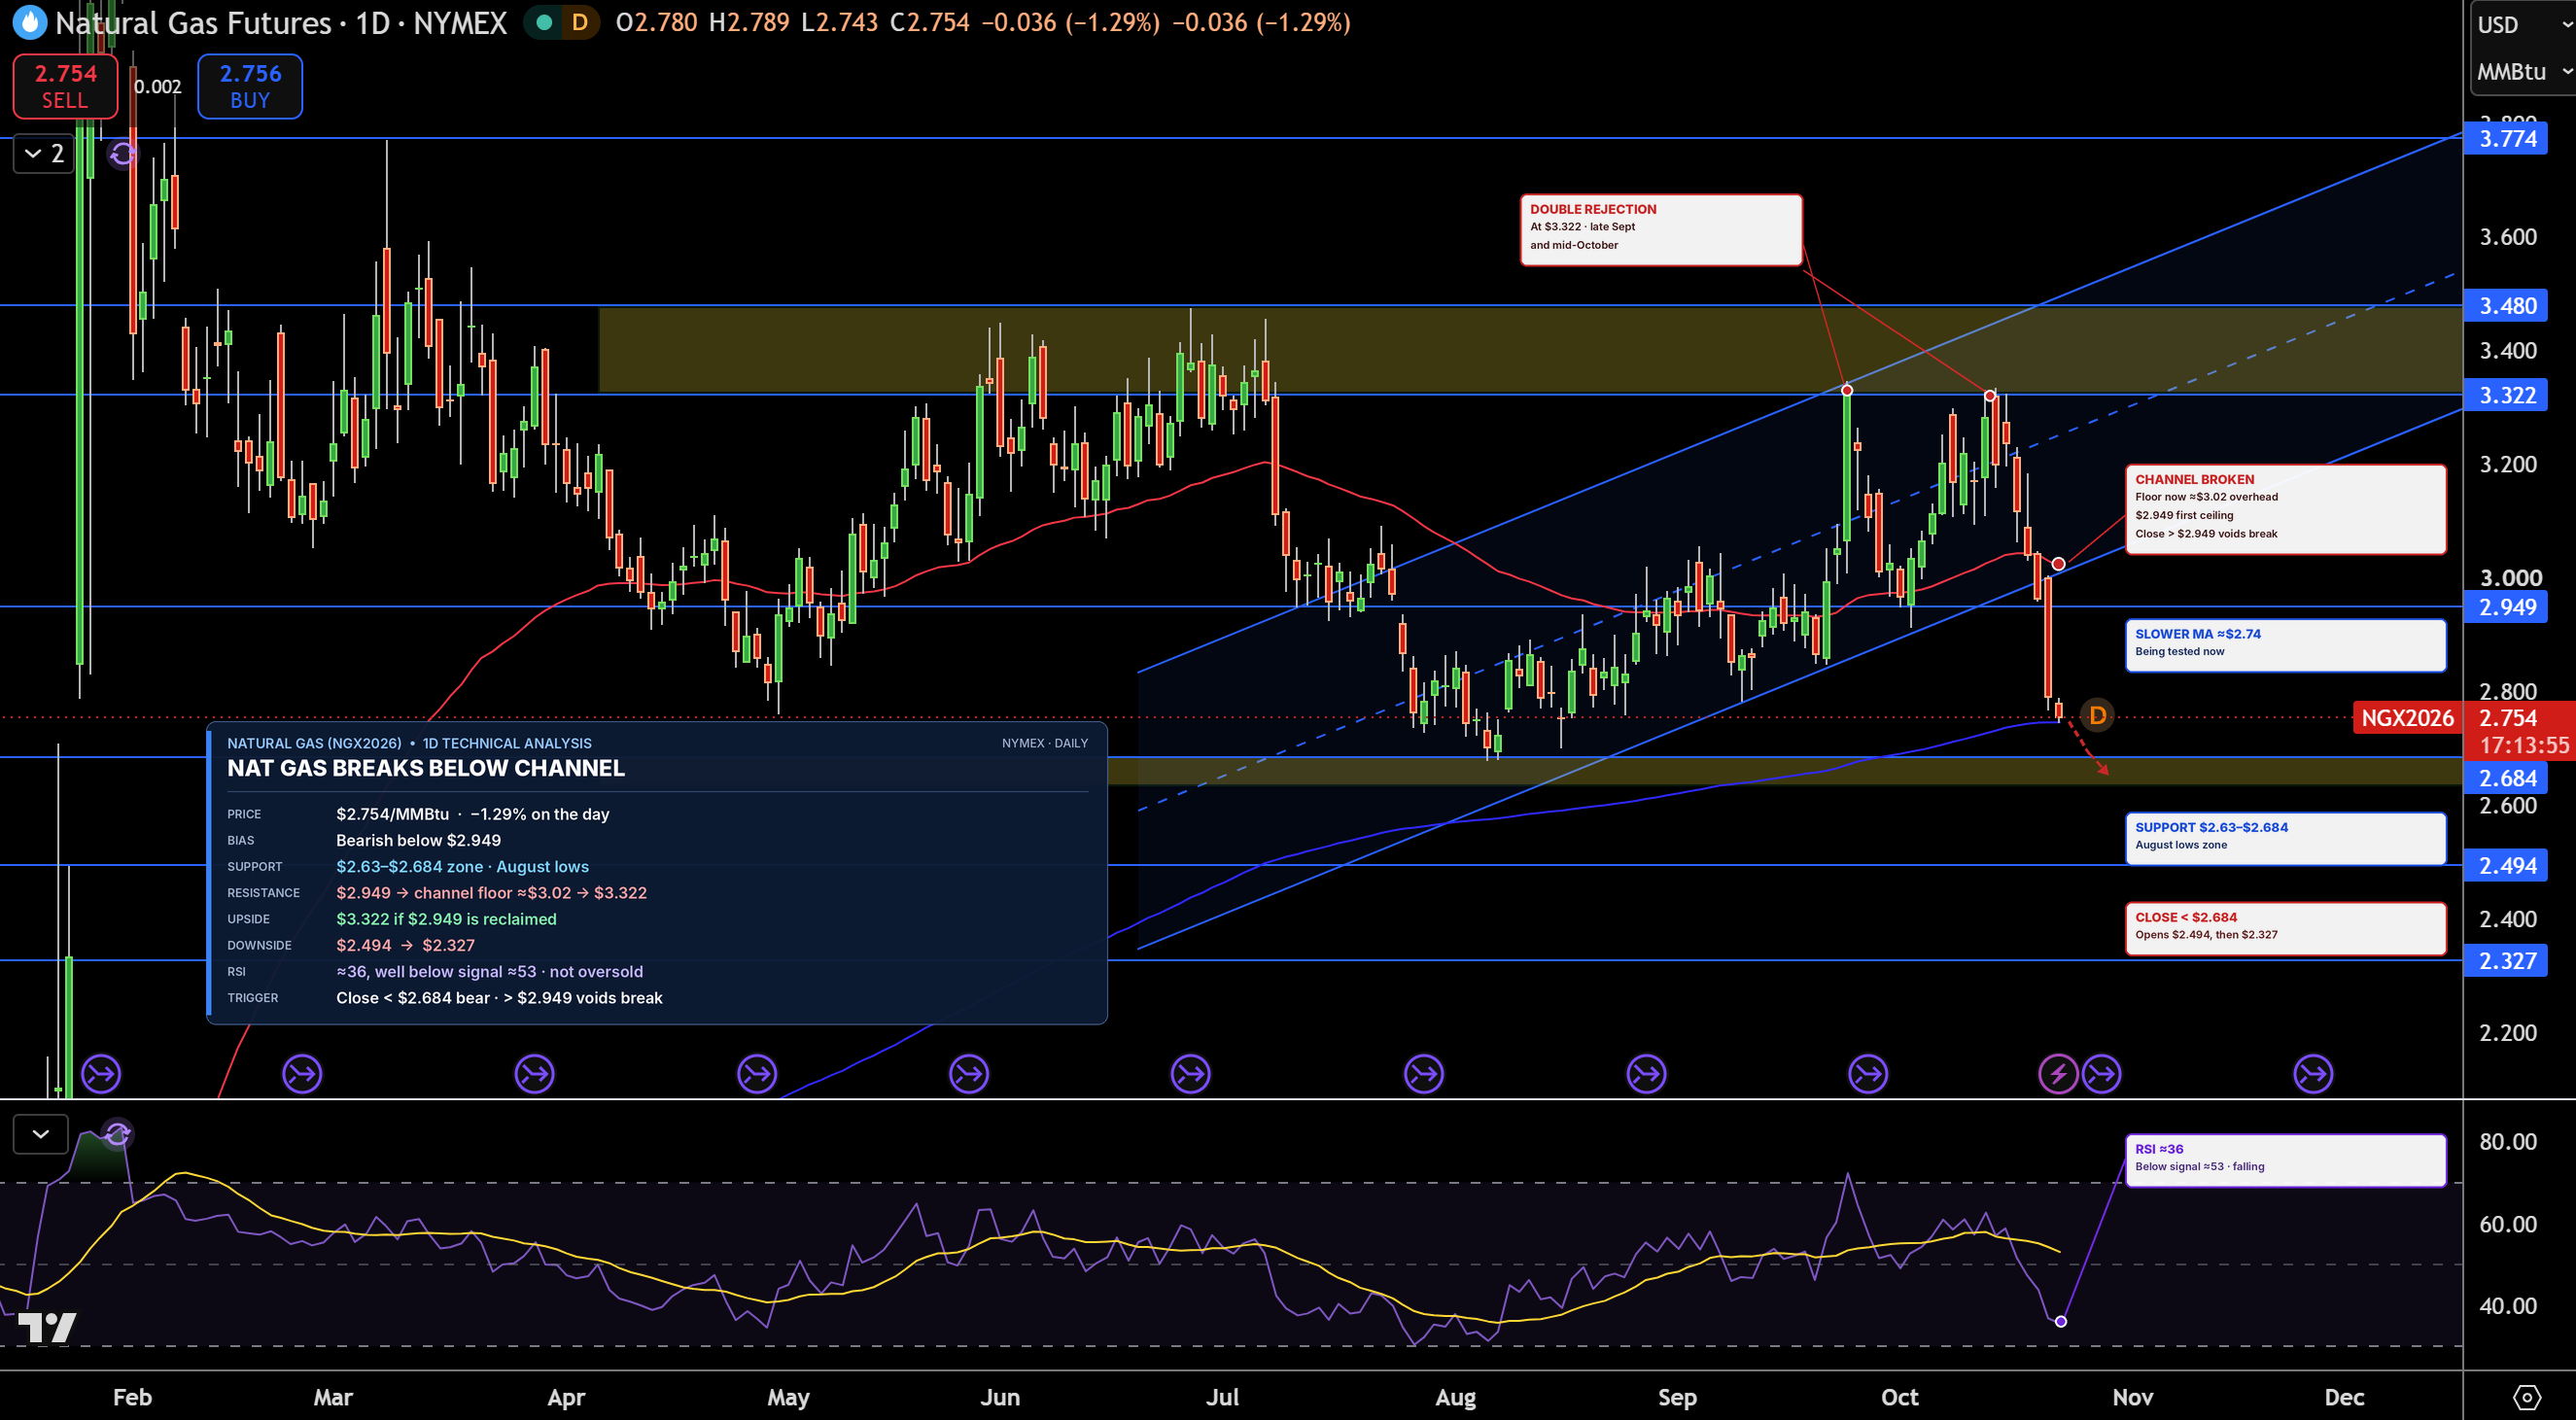
Natural Gas (NG) is trading near $2.75/MMBtu on the daily chart. What stands out is the sharp breakdown below the rising channel that has guided prices since July. That move followed a double rejection at the $3.32 resistance level. A single large red candle took price from near $3.00 to below $2.80. Natural gas is now testing the slower moving average, while the faster average has started to roll over.
The first support I am watching is the $2.63 to $2.68 zone, where the August lows were formed. A break below it would expose $2.49, followed by $2.33. On the upside, $2.95 is the first resistance, followed by the former channel floor near $3.02, which now acts as a ceiling. Above it sits $3.32.
RSI is around 36 and falling well below its signal line near 53, suggesting strong bearish momentum but not yet oversold. I am bearish as long as natural gas stays below $2.95. A daily close below $2.68 would strengthen the downside case, while a recovery above $2.95 would invalidate the breakdown.